GIS4DAR ArcGIS Training Workshop - September 7-8, 2017

Sorry, it has been a while since my last posting. I have been thinking of re-arranging the site to also include ArcGIS guides/tutorials as well as other software applications that I'm learning and experimenting with. For example, I'm currently learning about Docker and how to use it as a way to easily build web apps in a container environment. Also I've been learning Sphinx for documentation writing. I'll write something up once I'm done with experimenting.

So with that said, this post is a summary of an ArcGIS training workshop that I did earlier in September of this year that I'd like to share. Special thanks go out to Paulo Maurin, Gretchen Chiques, Annette DeRoches, and Risa Orem at the NOAA Inouye Regional Center, Ford Island for organizing the GIS4DAR workshop and inviting me to do the training.

The purpose of this training workshop was to teach the Hawaii Department of Land and Natural Resources, Division of Aquatic Resources (DAR) staff how to apply GIS to their research. 

Below is a synopsis taken from the GIS manual and a preview of the Table of Contents so you can see what the training was all about.  You can also download the GIS4DAR Training Manual - Please be patient. The pdf file is about 100 pages and is ~6 MB. The data for the training is really large (~1 GB) so I'm still trying to figure what is the best way to post it for downloading. But in the meantime if you would like it  - please email me directly.

About the Training/Tutorial

A GIS (Geographic Information System) is a computer-based system for the input, storage, analyses, and display of spatial data. This training workshop provides an introductory to intermediate training in GIS using ArcGIS Desktop 10.4.1. No GIS experience is required. The purpose of this training is to get you up and going using and applying GIS to your research without spending a lot of time learning it. The training is hands-on and project-based, meaning you will learn how to apply GIS to a project from start to finish. More specific to the software, ArcGIS 10.4.1 that will be taught, you will learn how to:

  • Use the ArcCatalog application to store, organize and manage spatial data such as creating geodatabase and metadata.

  • Use the ArcMap application to view spatial data and make maps/visuals; and learn the basics of cartographic design.

  • Use the ArcToolbox application to process/analyze spatial data, such as deriving slope from a bathymetry model (or DEM) and doing data conversion. 

  • Use the Model Builder application to create models and create a project work-flow process.

  • Use the Spatial Analyst Toolbar to do raster analyses, such as calculating the shortest or least cost path from one location to another.

The training is broken up into 2 sections, an ArcCatalog section with 3 exercises and an ArcMap section with 10 exercises. The ArcGIS Desktop 10.4.1 with a Standard or Advanced license plus separate Spatial Analyst and an optional 3D Analyst Extensions are required.  

Case Example: Interisland Ocean Cable Project
The case example being used in this tutorial is based on a project done in 2009 conducted by UH Manoa, School of Ocean and Earth Science and Technology (SOEST). More information for the survey project can be at: http://www.hawaiicleanenergyinitiative.org/storage/interisland_cable.pdf (last accessed 8/24/2017).

Note that the methods used in this tutorial are only for the purpose of teaching GIS/ArcGIS, and are not necessarily reflective of the actual methods used in the real project. 

Case scenario: As part of a renewable energy initiative, the Hawaiian Electric Company (HECO), with assistance from the State of Hawaii (DBEDT) is planning to integrate wind energy into the Oahu electrical system. The wind energy is expected to come from one or more wind farms on Lanai and/or Molokai and transmitted to Oahu via an interisland, undersea cable system.  The proposed plan is to have either 1) two, 200 MW wind farms: one on Lanai and another on Molokai to integrate with Oahu’s electric grid, or 2) a single 400 MW facility either on Lanai or Molokai to integrate with Oahu’s electrical grid system. A later phased cable extension to Maui is also being looked at. 

Your Task: To determine if it’s feasible to have such an undersea power transmission system and if so suggest possible cable transmission routes.

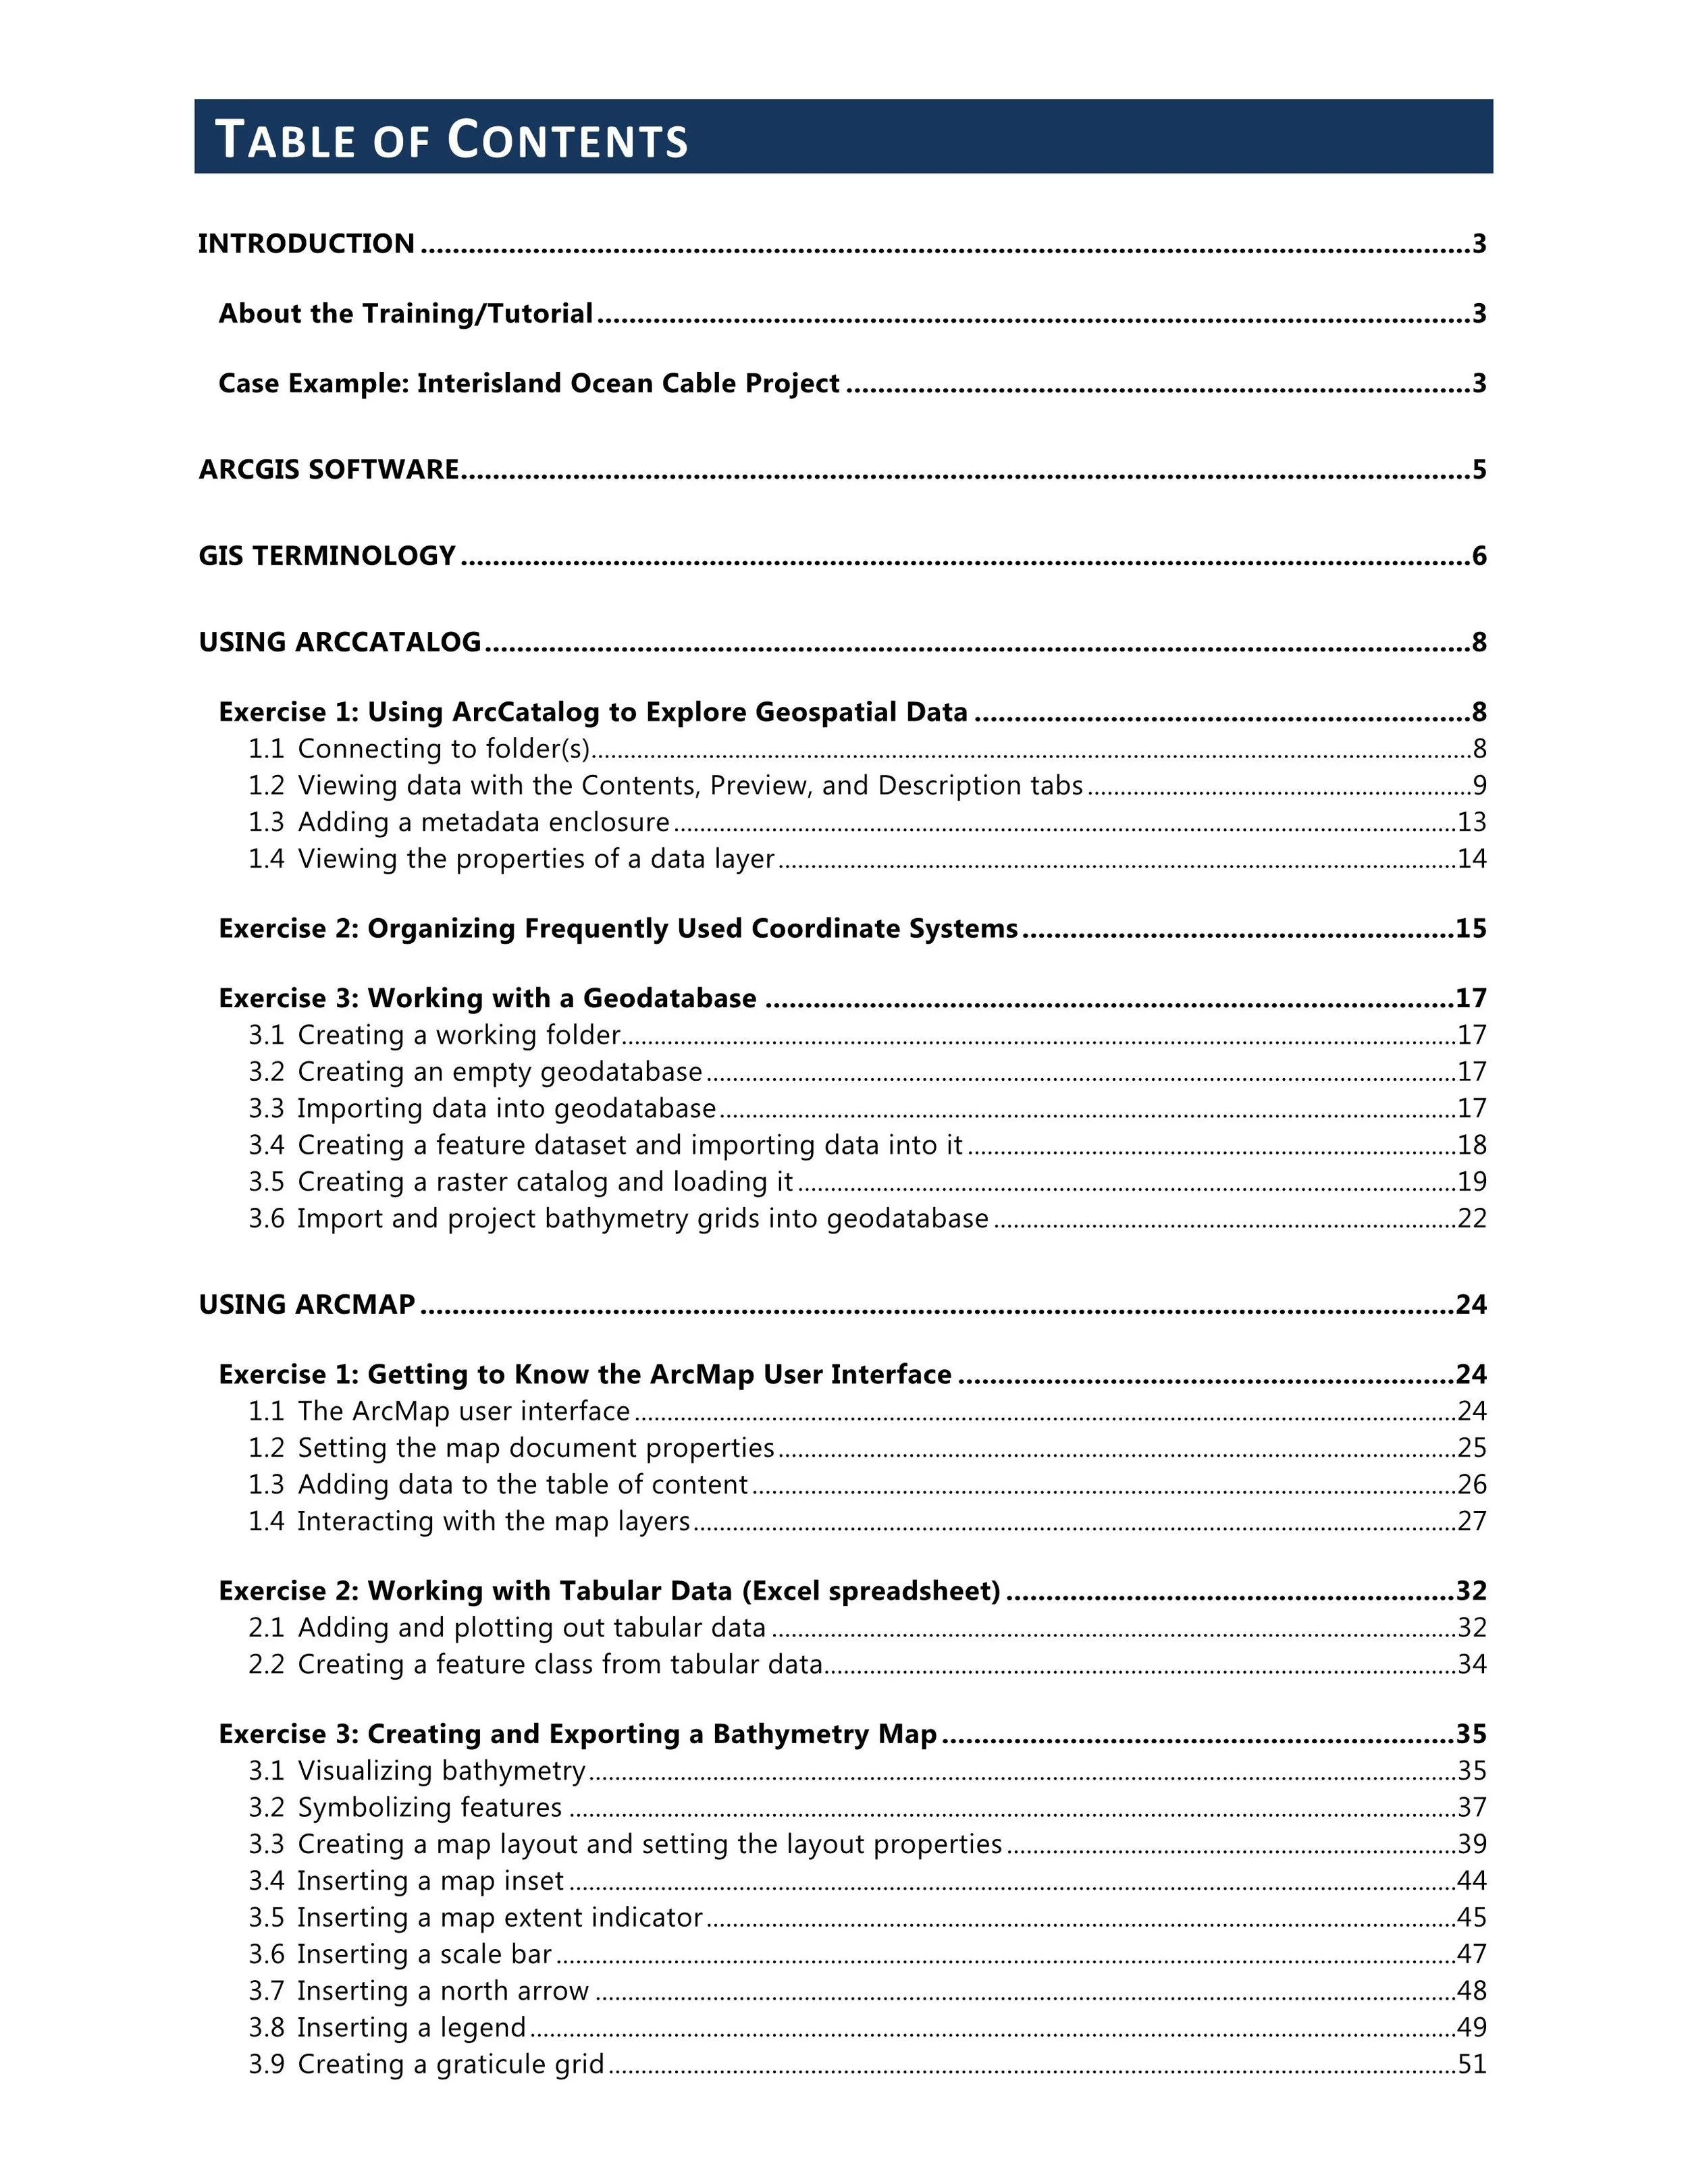
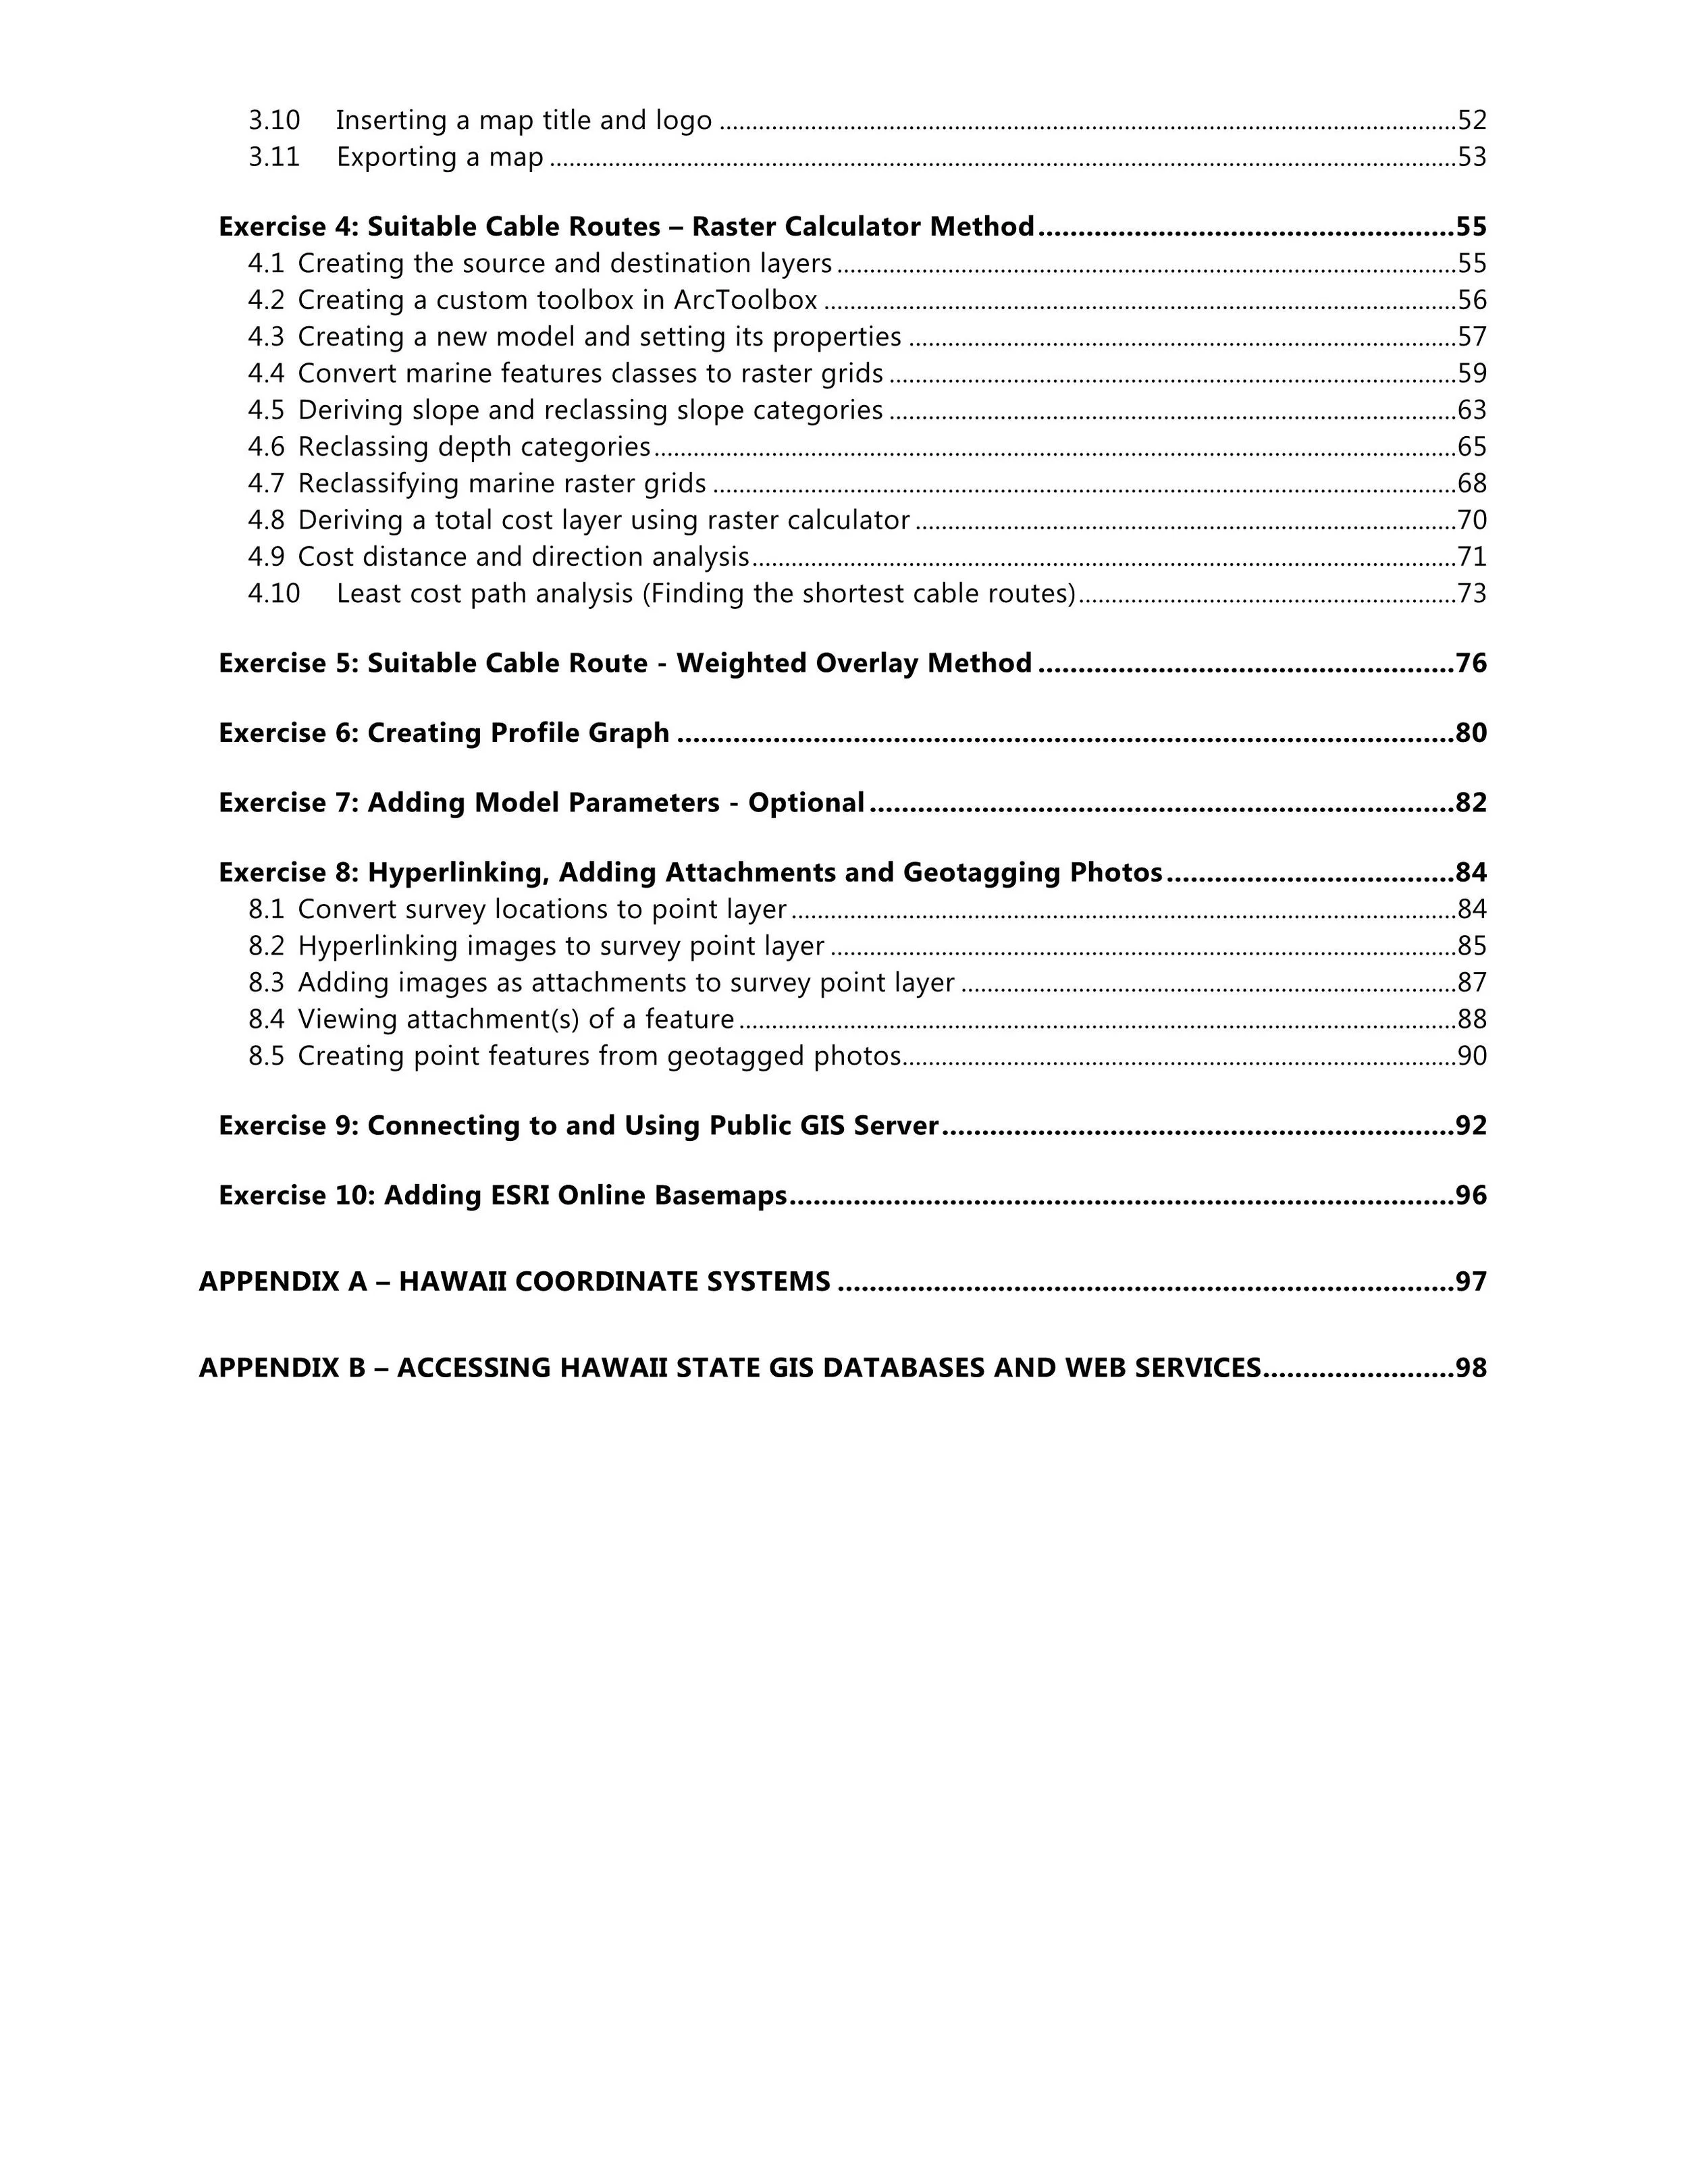
Preview of the Table of Contents 

Note: Appendix B is not included in the tutorial for download here as it only pertains to Hawaii State Employees

TOC.jpg
TOC2.jpg

Open Source GIS Implementation - Part 4 Installing GeoServer

Sorry for the delay in posting part 4. I've been a little busy lately but here it is. Part 4 goes over how to install GeoServer and how to publish a PostGIS database to it. Here I am using GeoServer 2.10.1 Installation was done on both a Windows 10 laptop and Windows Server 2012R machine for testing.

There is more detailed instructions on the GeoServer site which you should read. The instructions were easy to follow, so there's no need to rewrite it so here. I'm just giving a summary of what I did.

JRE 8

  • JRE 8 is required.

  • Download JRE 8 from Oracle

  • I installed both x86 (jre-8u121-windows-i586.exe) and x64 (jre-8u12-windows-x64.exe) versions.

Installing GeoServer 2.10.1

I found the installation process to be fairly easy. The only thing I had to do was make sure that the JRE path was correct. I have both the x64 and x86 JRE 8 versions installed - the default option during the installation process uses the path to the the x86 JRE (e.g. C:\Program Files \(x86\)\Java\jre8\). I left the path as the default since I want to run GeoServer as a service, which requires 32bit JRE (i.e. x86 JRE version\).   

Once the installation completes and if you're able access the Geoserver web admin page from the program menu or by opening a web browser and typing http://localhost:8080/geoserver/web then you're good.   

If you can access this page then it means GeoServer was installed properly

If you can access this page then it means GeoServer was installed properly


Installing GeoServer Extensions

There are many GeoServer Extensions -- you should read about them and decide which one you want to install to extend the functionalities of your GeoServer. These are the ones that I installed on my GeoServer. They seemed to have been installed properly but haven't been fully tested out yet. There are tutorials on the GeoServer site you can explore.

  • Vector Tiles - outputs json, geojson, topojson, mbtile 

  • Importer - batch uploading of data via a GUI

  • YSLD -  styling of layers in YSLD format (easier to do/read then SLD)

  • Printing Module - printing using Mapfish printing service. I installed this put haven't figured it out or worked with it yet. I will post my notes when I get it working.

You can download the extension(s), here. Mark sure the extension(s) you download matches your GeoServer version, in this case it is 2.10.1. The Vector Tiles extension for GeoServer 2.10.1 can be found in the community-latest folder. With GeoServer 2.11 Vector Tiles is part of the core extensions. The instructions from the GeoServer site to install the Vector Tiles extension is for GeoServer 2.11 but it is sill applicable to version 2.10. You can read the instructions here

Basically you just download and extract the jar files for the extension and put them in the directory of your GeoServer’s WEB-INF\Lib folder (e.g. C:\Program Files\(x86)\GeoServer 2.10.1\webapps\geoserver\WEB-INF\lib\).

After you copy and paste the jar files into the correct directory, the instruction guide (above links) says to restart GeoServer. That didn't work for me on my Windows 10 laptop. I had to restart my computer then restart GeoServer before I could see the added extension. The same thing happened on a Windows 2012R Server - I had to restart the server, then restart GeoServer and wait for a few minutes (up to 5 minutes) then refresh the GeoServer Web Admin page to see the extensions showed up.

Verifying Extensions Installed properly

Vector Tile Extension

If you log into the Geoserver through the web admin page and click on a layer and then click the Tile Caching Tab you should see the vector tile output options that you just added to GeoServer.

Output options available after installing the Vector Tiles extension

Output options available after installing the Vector Tiles extension

Importer Extension

If the Importer extension installed properly then you should see a new tool, called Import Data under Data Section in the left hand side of the GeoServer web admin page. 

YSLD Extension

If the YSLD extension installed properly then you should be able to see the available format under Data >> Styles >> New Style. With this extension, you can style layers in YSLD and SLD formats. As you can see from the example below, I've also added the CSS extension for styling layers in CSS format. See link here for more information on styling in GeoServer. There are even styling cookbooks available to make it easier.


Importing Data to GeoServer

This section goes over how to use the Import Data tool to batch import a PostGIS database. Using the Import Data tool is a much easier option than having to use cURL command line option to do batching data importing to GeoServer. 

Create a new Worskspace and Data Store

Open the GeoServer web admin page - login if needed. Then under the Data section, click Workspaces >> Add new workspace

In the new workspace window that comes up, type in a name for your new workspace - limited to 10 characters and no spaces (e.g. CCH). For Namespace URI (Uniform Resource Identifier) this can be anything - according to the GeoServer site, a URI is similar to a URL except it does not need to point to an actual location on the web. It just needs to be a unique identifier, such as http://g70.design/geoserver/CCH.

Type in a Name (limit to 10 characters & no spaces) and a URI

Type in a Name (limit to 10 characters & no spaces) and a URI

Batch Import Data

When you are done creating a new workspace, it's time to import some data into it. For this example, I'm batch importing some layers from a PostGIS database that I created earlier in part 3. 

In GeoServer, click Import Data. Then in the right hand panel, 1) Choose PostGIS as the data source to import from; 2) Under Configure the data source: fill in the appropriate information to connect to your PostGIS database; 3) Specify the Target for the Import: fill in the appropriate info for your workspace and data store - you can use an existing data store or create a new. If you create a new one - the store name will default to the name of your PostGIS table (e.g. workspace = CCH, store = CCHGIS (which is the name of my PostGIS database).

Substitute your own information in the fields above. For Store you can create a new one (default name store name will be the name of your database) or use an existing one. Click Next button

Substitute your own information in the fields above. For Store you can create a new one (default name store name will be the name of your database) or use an existing one. Click Next button

In the Import panel that comes up you should be able to see the PostGIS database you just connected to. Select the layer(s) that you want to import into the data Store. I think of the workspace as the directory and the store as a container for the data.  

Note: When batch importing I was only able to batch import layers that were on the same page. If I selected layers that were listed on page 1 then clicked to page 2 to select more layers then GeoServer only imported the layers I selected from the current page that I was on. This meant that I had to select all the layers I wanted to imported on page 1 then click Import and wait for it to successfully import, then go to  page 2 and repeat the process, etc. 

 Select the layers you want to import >> Click Import then want for the layers to be successfully imported before importing more layers on page 2, 3, etc. See Note above.


Select the layers you want to import >> Click Import then want for the layers to be successfully imported before importing more layers on page 2, 3, etc. See Note above.

If you go to the Stores panel, you will see the newly created Workspace (e.g CCH) and the Store (CCHGIS, which is also the name of my PostGIS database).

If you click on Layers in the left hand panel, you will see the layers that were imported. Notice under Name, it is the workspace name followed by the layer name (e.g. CCH:park) and the Store is CCHGIS.

You can also preview the layers by Clicking Layer Preview in the left hand panel then click OpenLayers (under Common Formats heading). Notice that the layer is given a default feature color. 

Below is an example layer preview of the park layer with polygon features shown in gray  (default color).


Styling Layers

Styling layers in GeoServer can be done using SLD, YSLD, or CSS. See the GeoServer Styling Workshop for more info. Supposedly you can use QGIS to create SLDs – this would be an easy option, however, when I tried it using QGIS 2.18.3 it didn't work. Out of curiosity I also tried exporting an SLD using an extension in ArcGIS, called Arc2Earth -  this didn't work either.  So for now I guess the best way to create and edit styling in GeoServer is directly edit XML or use the GeoServer style editor.

Click on Styles in the left hand panel then in the right hand panel you can either Add a new style or click on an existing style to edit it. Notice there are already default styles for the layers I batched imported (e.g. CCH_citynopass, CCH_coastline, etc). You can either delete then and create new ones or edit them - whatever you prefer.

Below is a snapshot of the New Style window. Choose a format then either upload an existing style file or use the Style Editor to write your own styles. I highly recommend reading the GeoServer Styling Section. It has lots of useful info, including "cookbook recipes" you can copy and edit for your purpose.

Here is a sample of a style in YSLD format I created for a zoning layer. Notice under Format, you can't change the format from one to another (e.g. can't switch format from YSLD to SLD). Also notice there are 3 tabs: Publishing, Layer Preview, and Layer Attributes -- these are shown below.

With the  Publishing tab you can select which layer the style is associated with and whether it is the default style for that layer. Here I am associating my CCHzoning style to the zoning layer and making it the default symbology.

The Layer Preview tab gives you a preview of your style. Any changes/edits made in the Style Editor will be reflected in the preview. Notice where it says "Previewing on layer: CCH:zoning_luo" - make sure this corresponds correctly to your style. I've had it where maybe I forgot to check of something and I'm not previewing on the correct layer (i.e. Previewing on layer: CCH_TMK but my style is for zoning so nothing shows up in preview). If this happens, you can click on the layer name and then you can select the correct layer. 

 Make style changes/edits using the Style Editor to see a preview of what changes will look like. You may have to click the Apply button to see the changes. Use the Validate button to help you "debug" your style structure. Use the Submit button to f…


Make style changes/edits using the Style Editor to see a preview of what changes will look like. You may have to click the Apply button to see the changes. Use the Validate button to help you "debug" your style structure. Use the Submit button to finalize/save the changes.

The Layer Attributes tab will allow you to see the attribute field names, and type associate with the layer.  

It takes a bit of work to do the styling but it's not that hard to do. It's just a hassle and not as easy as just being able to use SLD created in QGIS. I'm hoping the SLD from the next version of QGIS will work with GeoServer. 


Publishing Layers

Once you've create styles for your layer then the next thing you'd want to do is publish them as WMS, WFS, etc. Click on Layers in the left hand panel then select a layer to edit its properties. There are 4 tabs: Data, Publishing, Dimension, and Tile Caching. I would suggest reading up on all the options within these tabs to properly configure and publish your layers. Don't forget to click the SAVE at the bottom of each tab after you make your changes. 

The Data tab, shown below is basically the metadata for your layer. Fill in any input that is needed, make sure the layer is enabled though.

The Publishing tab allows you to edit the WFS and WMS settings for the layer. Notice the default style for WMS is the zoning style I created earlier.

The Dimension tab allows you to enable a time and elevation dimension if your layer has these properties.

The Tile Caching tab is where you can create caches for your layer. and select the tile image format. Notice you will not have these formats: geojson, topojson, utfgrid, or mapbox-vector if you didn't install their respective extensions. 

Once your layers are published you should test it out to see if your GeoServer services are working by trying to call them in a web mapping application or in a desktop GIS software (e.g. ArcGIS, QGIS). Below are some examples of my GeoServer services as shown in a Leaflet and Open Layers web maps, and  in ArcGIS and QGIS.

Leaflet map showing layers from my GeoServer

Leaflet map showing layers from my GeoServer

Open Layers web map showing the park layer from my GeoServer

Open Layers web map showing the park layer from my GeoServer

My GeoServer added in QGIS with zoning layer displayed

My GeoServer added in QGIS with zoning layer displayed

My GeoServer added in ArcCatlog with a preview of the zoning layer.

My GeoServer added in ArcCatlog with a preview of the zoning layer.