
DEM and Contour Visualization in QGIS
This short write up is a follow up to the previous tutorial on creating contours from SRTM DEM. Here are some quick tips and tricks for visualizing contours and DEM in QGIS. I am using QGIS v3.22 so if you are using an older version of QGIS the visualization/rendering options may not be available. I am also using the SRTM DEM (e.g. N45W122.hgt) that I downloaded for Mount Hood area from the previous tutorial on creating contours from SRTM DEM.
Tip 1: Contour Rendering
Instead of using the Raster >> Extraction >> Contour tool to generate contours from a DEM, you can just apply the Contour rendering style on the DEM raster. Note though this is only for visualization purposes. Under Symbology, select Render Type = Contours. There are options to create contour intervals and index contours. See an example below with contours displayed at 10 meter intervals with index contours every 50 meters.
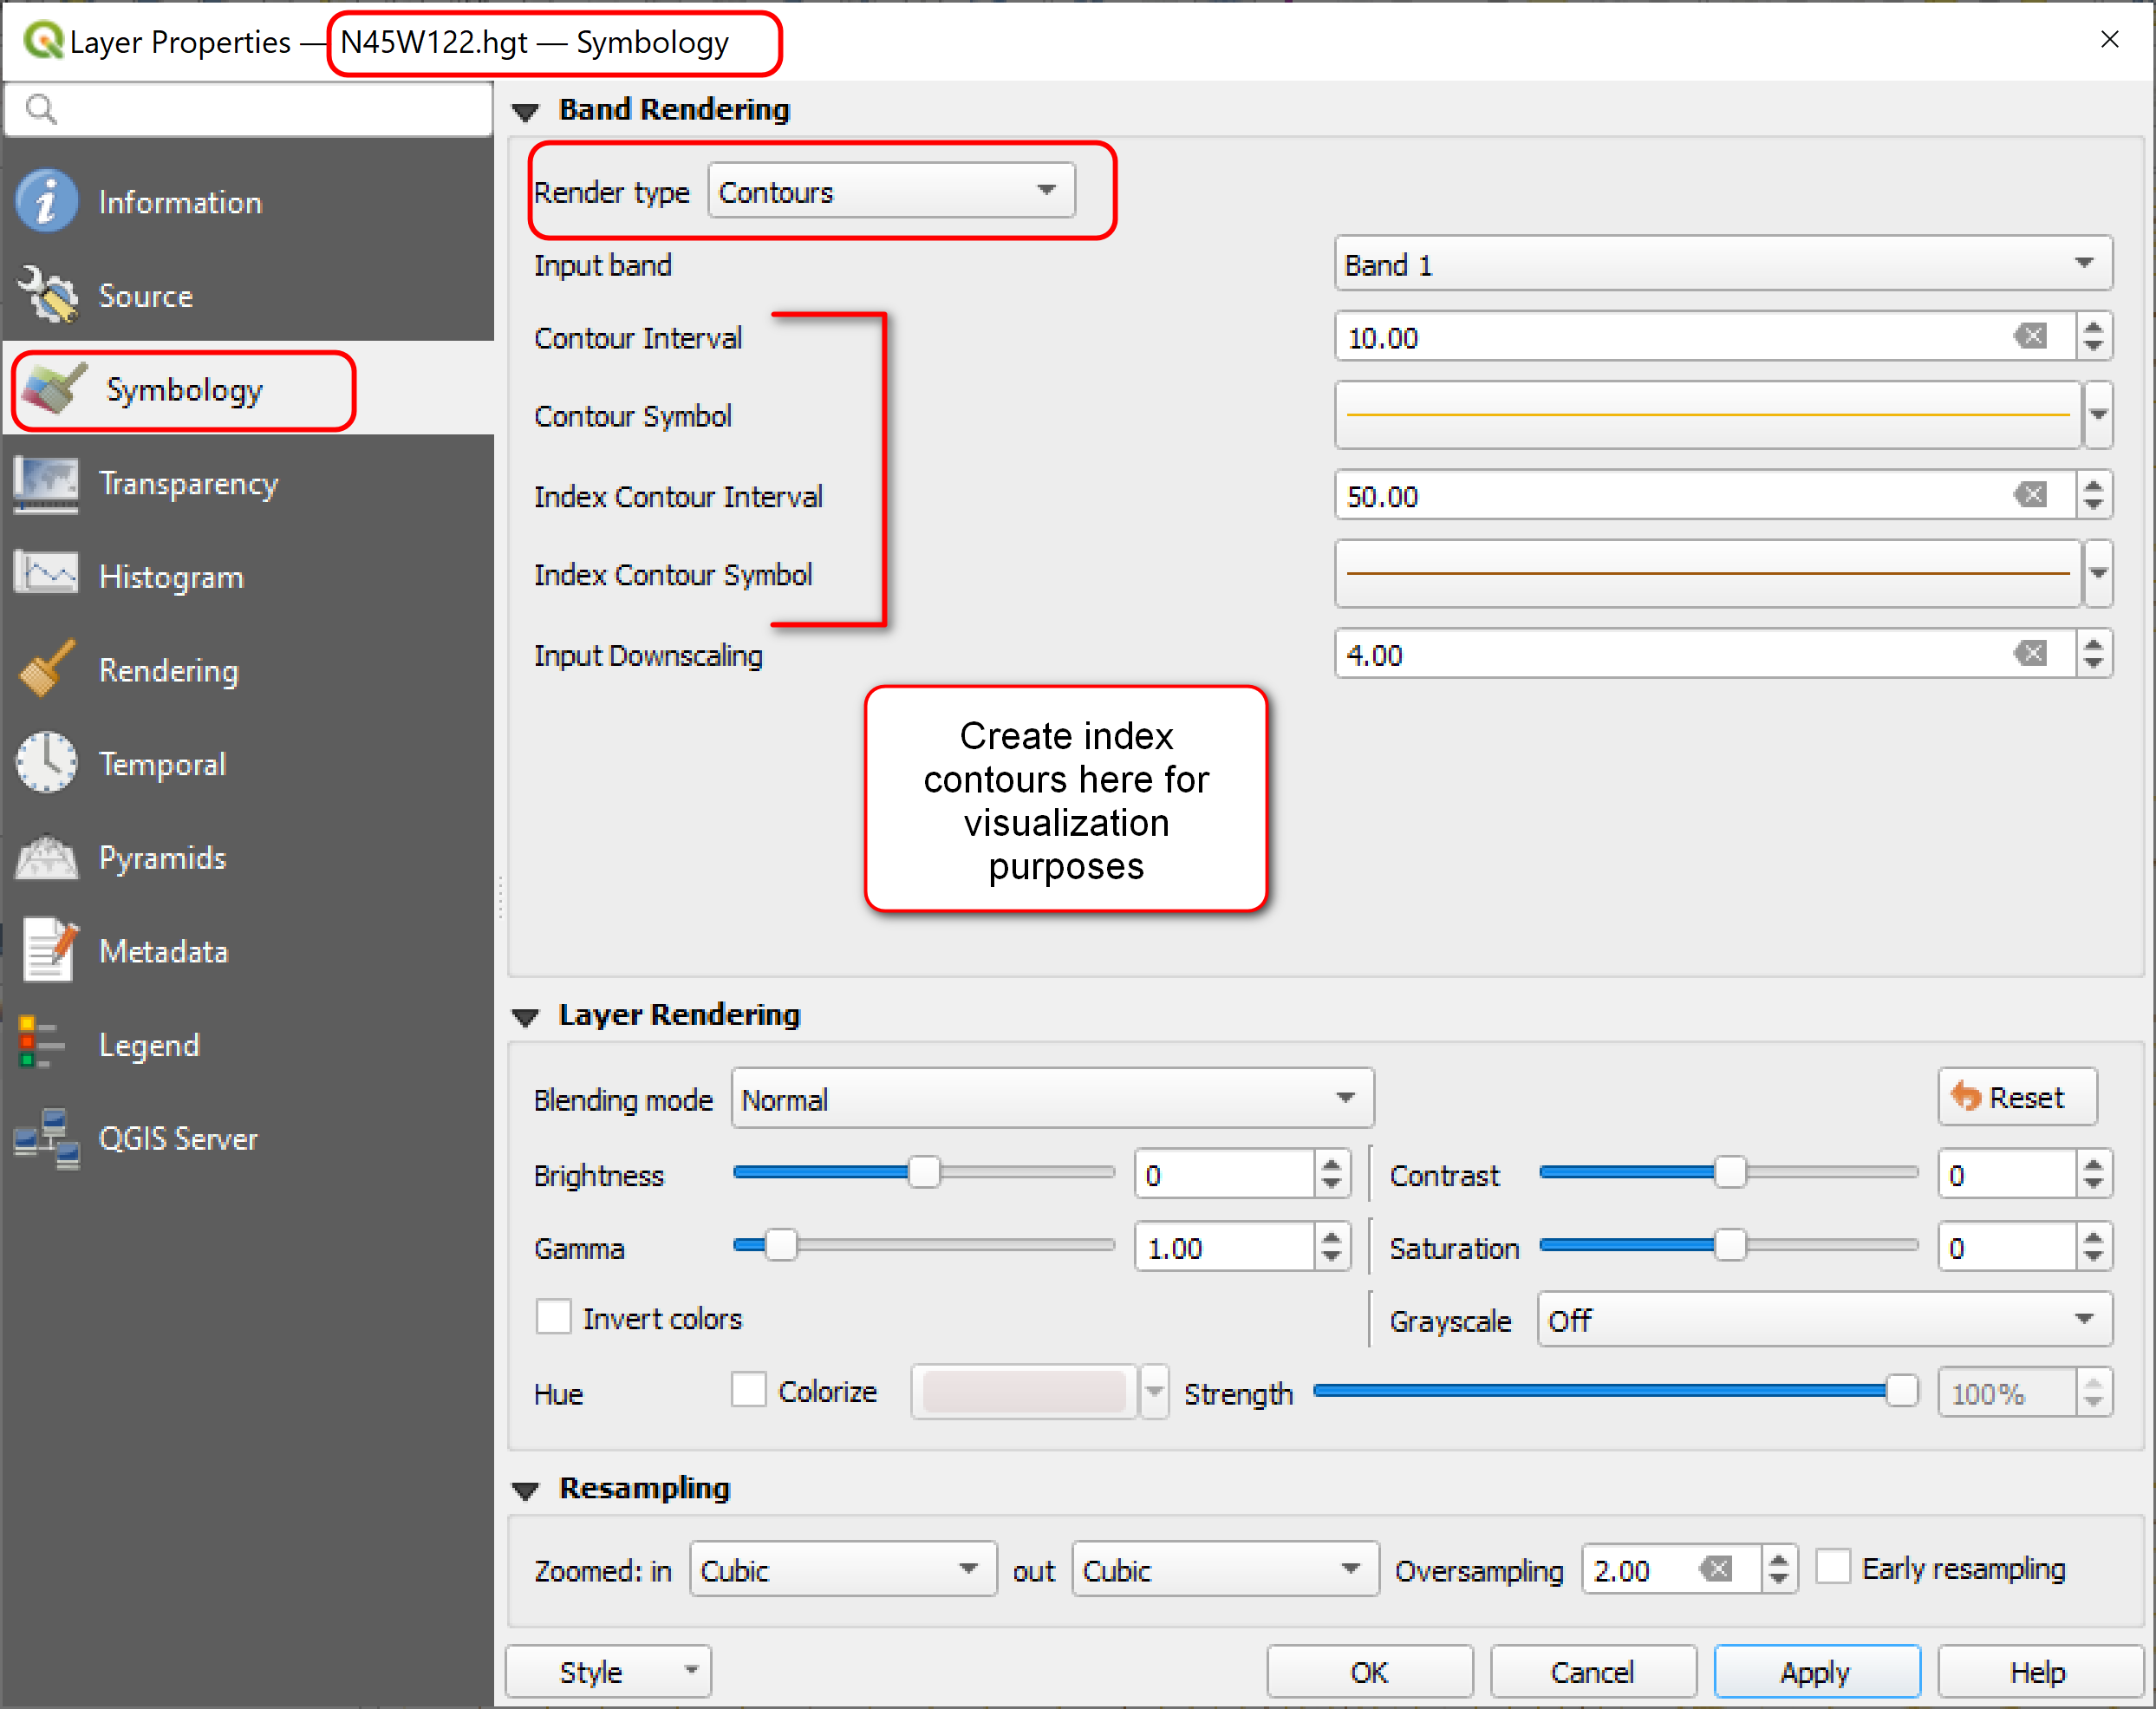
Contour rendering options for DEM
Tip 2 : Hillshade Rendering
You can also make a copy of the DEM (copy and paste raster in the TOC) and apply a hillshade rendering as well to get a 3D-ish visualization on the DEM. Play around with the different options to see what will give you the best result.
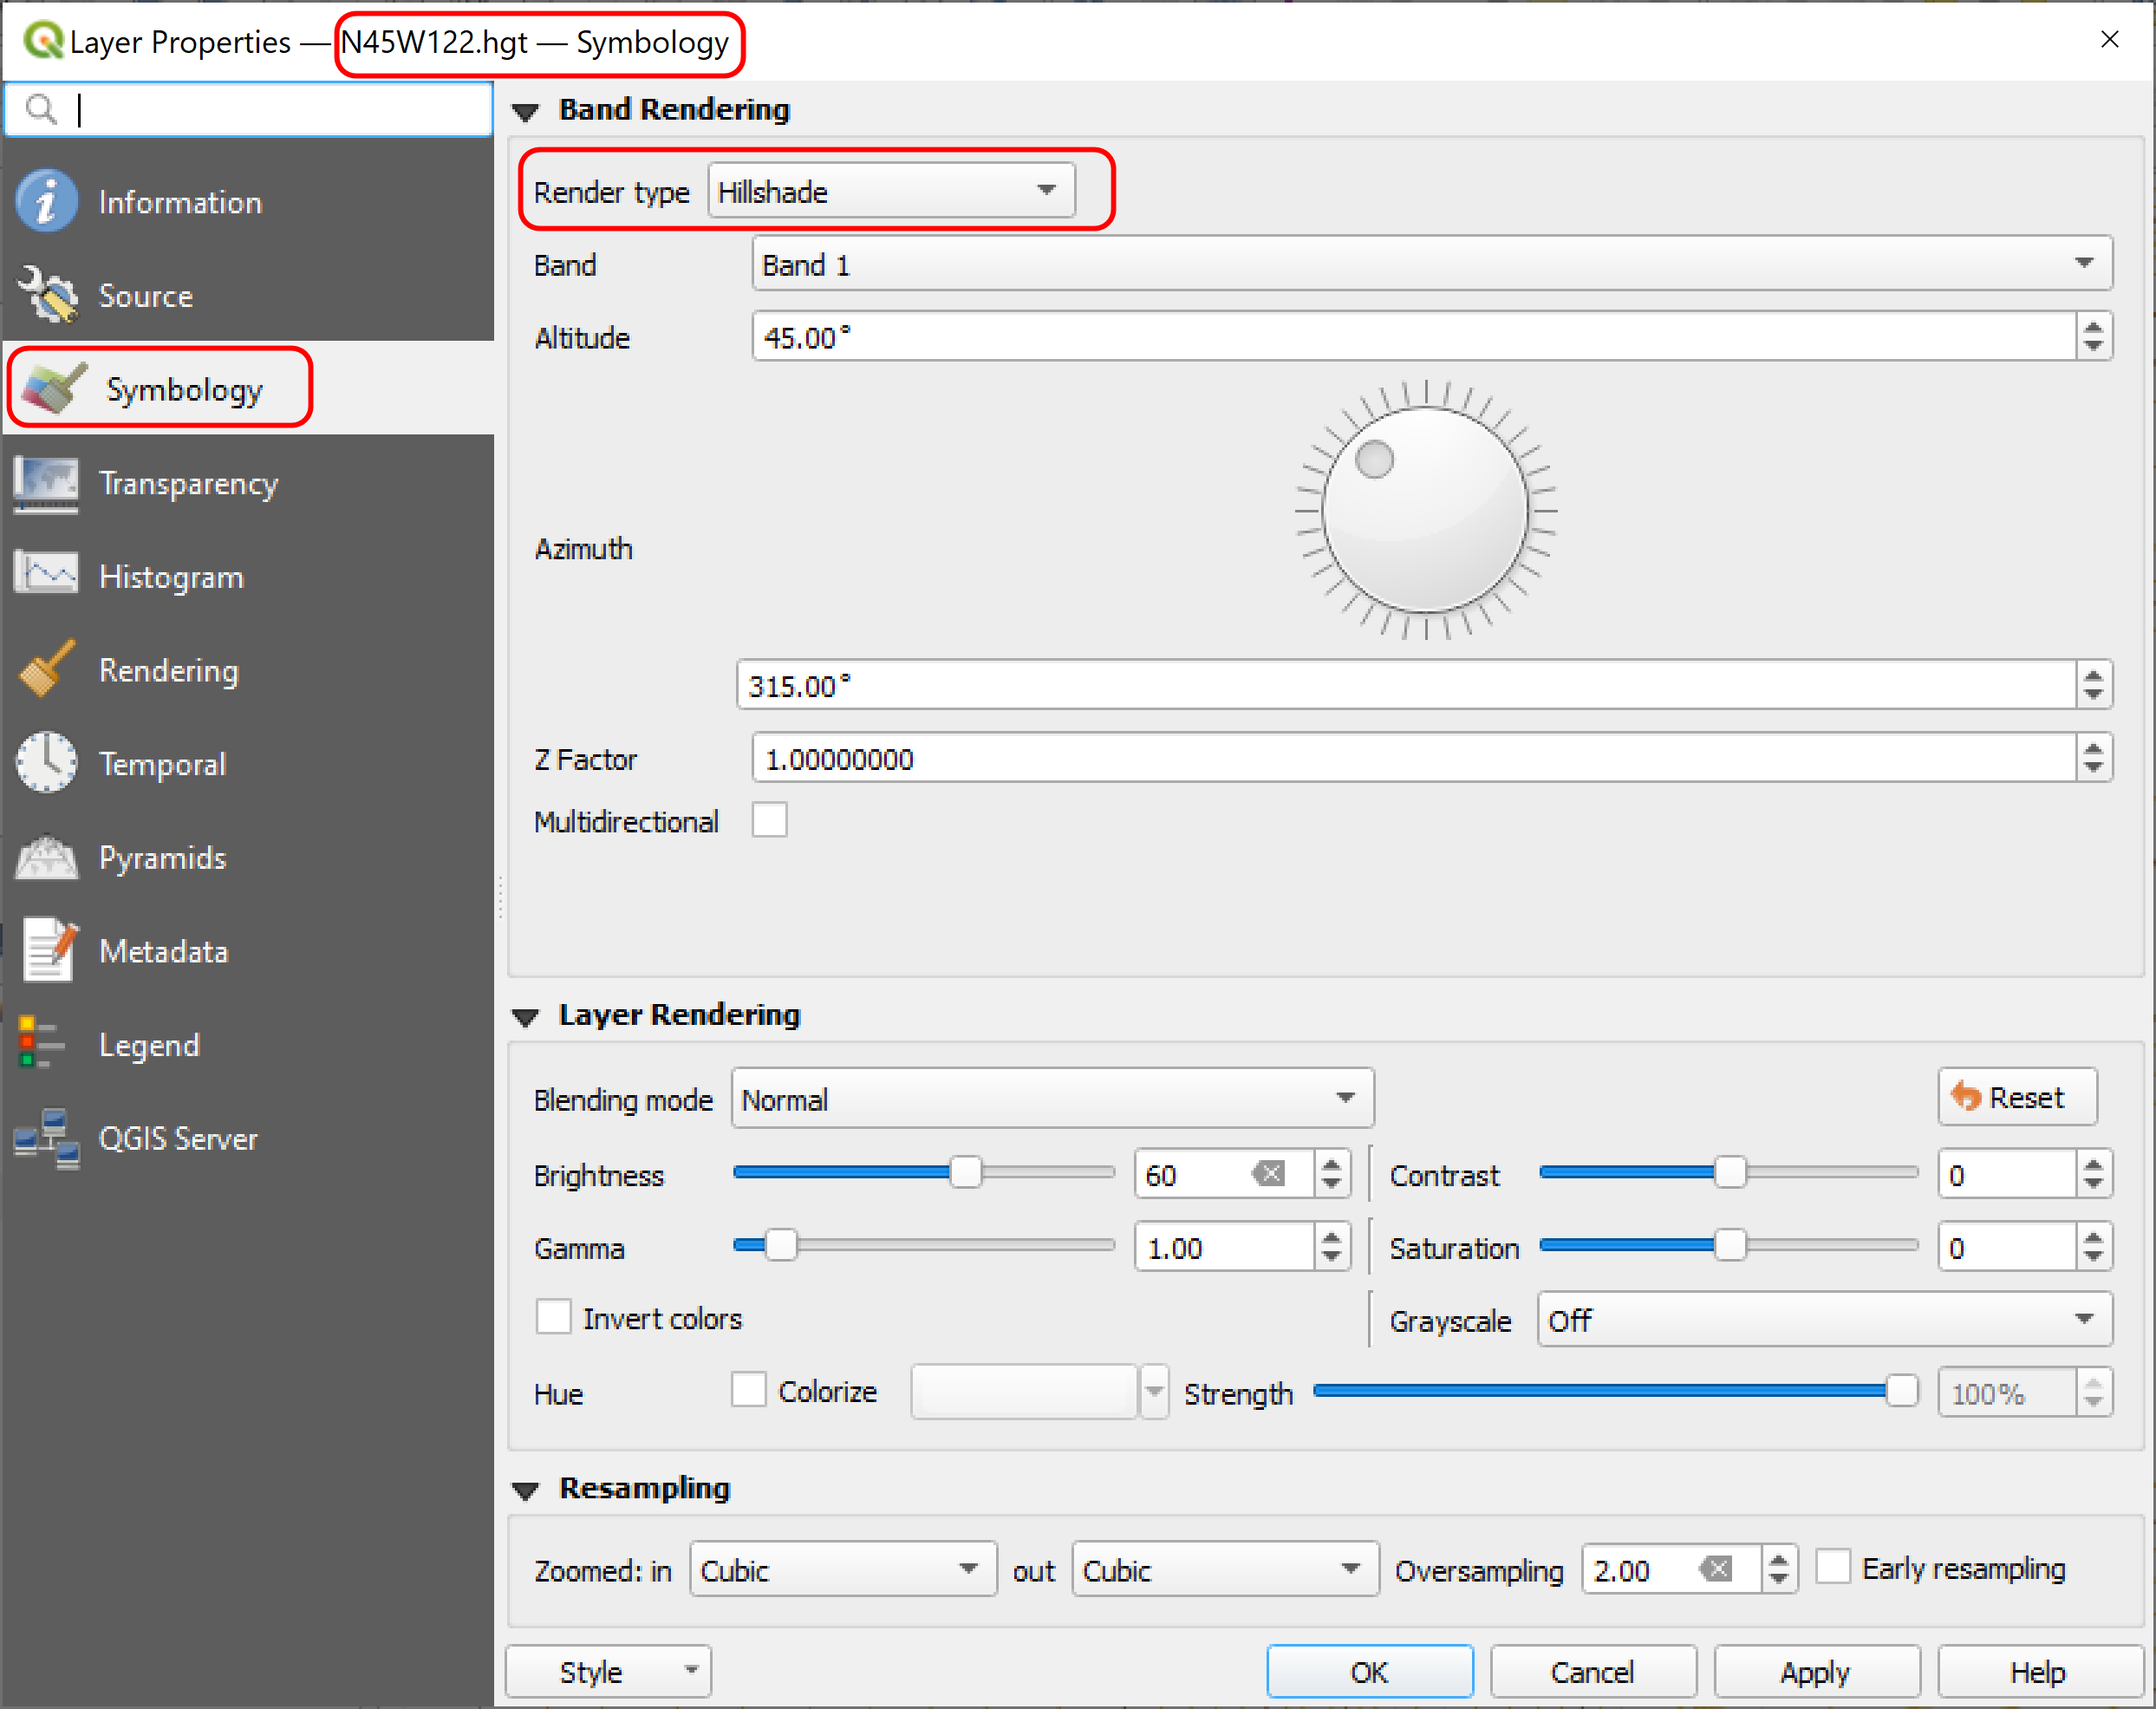
Hillshade rendering options. Note: Hillshading on my .hgt DEM came out really dark.
Here is an example of my contours rendering on top of a hillshade and a single pseudocolor option.
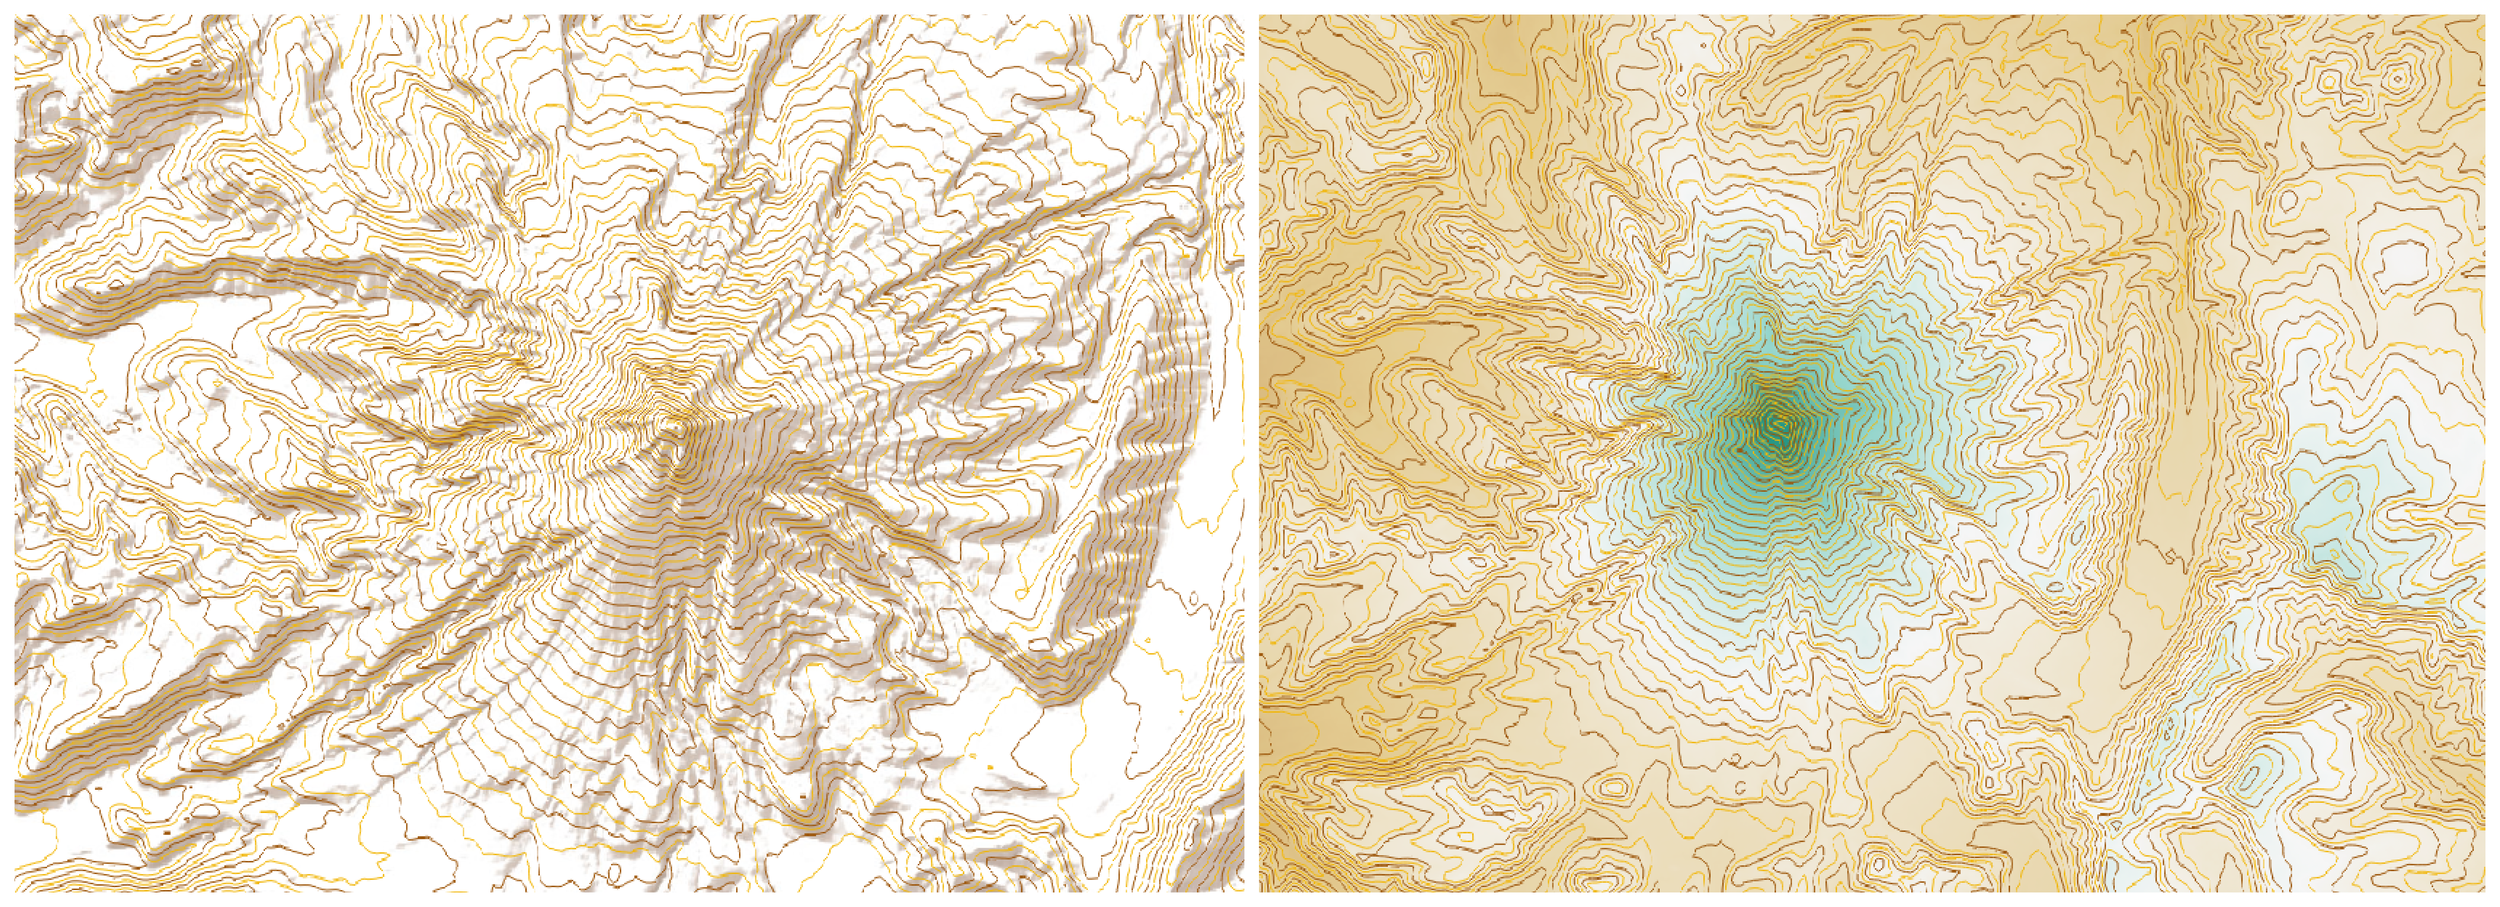
Left: Contour (index = darker line) on top of ESRI terrain imgaery; Right: Contour (index = darker lines) on top of SRTM DEM (N45W122.hgt) singleband pseudocolor
Tip 3: 3D Map View
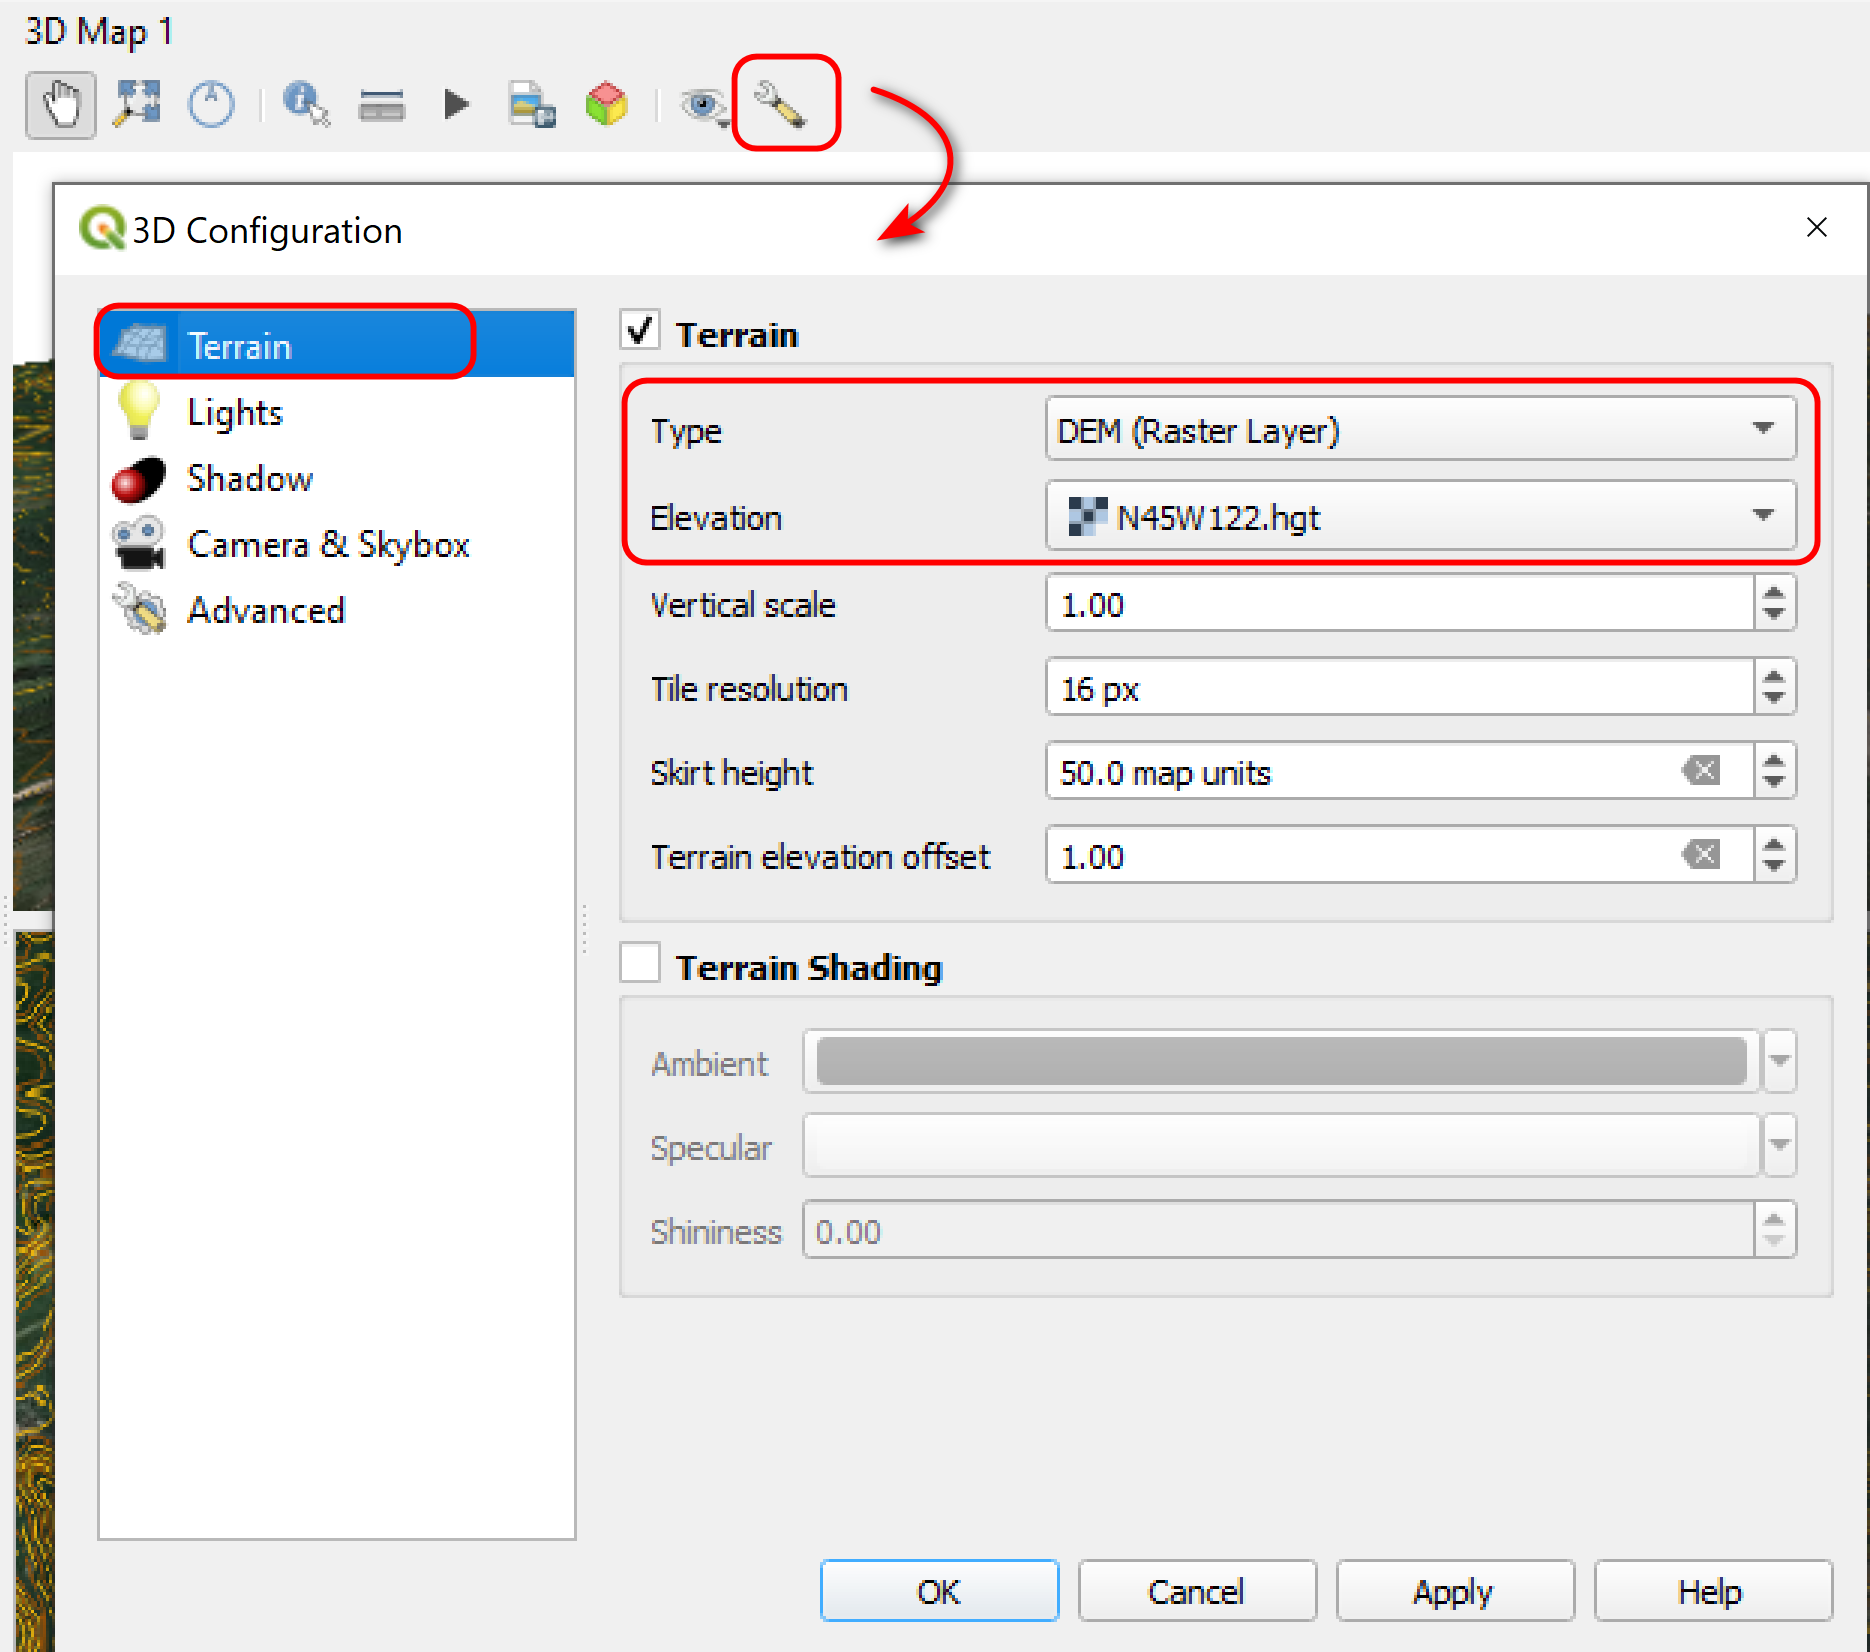
Create a 3D map view along with a 2D view of the contours. Go to View menu >> New 3D Map View. You may get a warning popup that 3D Map View doesn’t support unprojected coordinate systems - in this case, just change your project’s coordinate system (e.g. WGS84 UTM Zone 10 meters) then open the 3D map view again.
In the 3D Map window, make sure you change the Terrain configuration to use the DEM raster (the default is a flat flat terrain view). See example below: Type = DEM (raster layer) and Elevation = DEM file (e.g. N45W122.hgt).
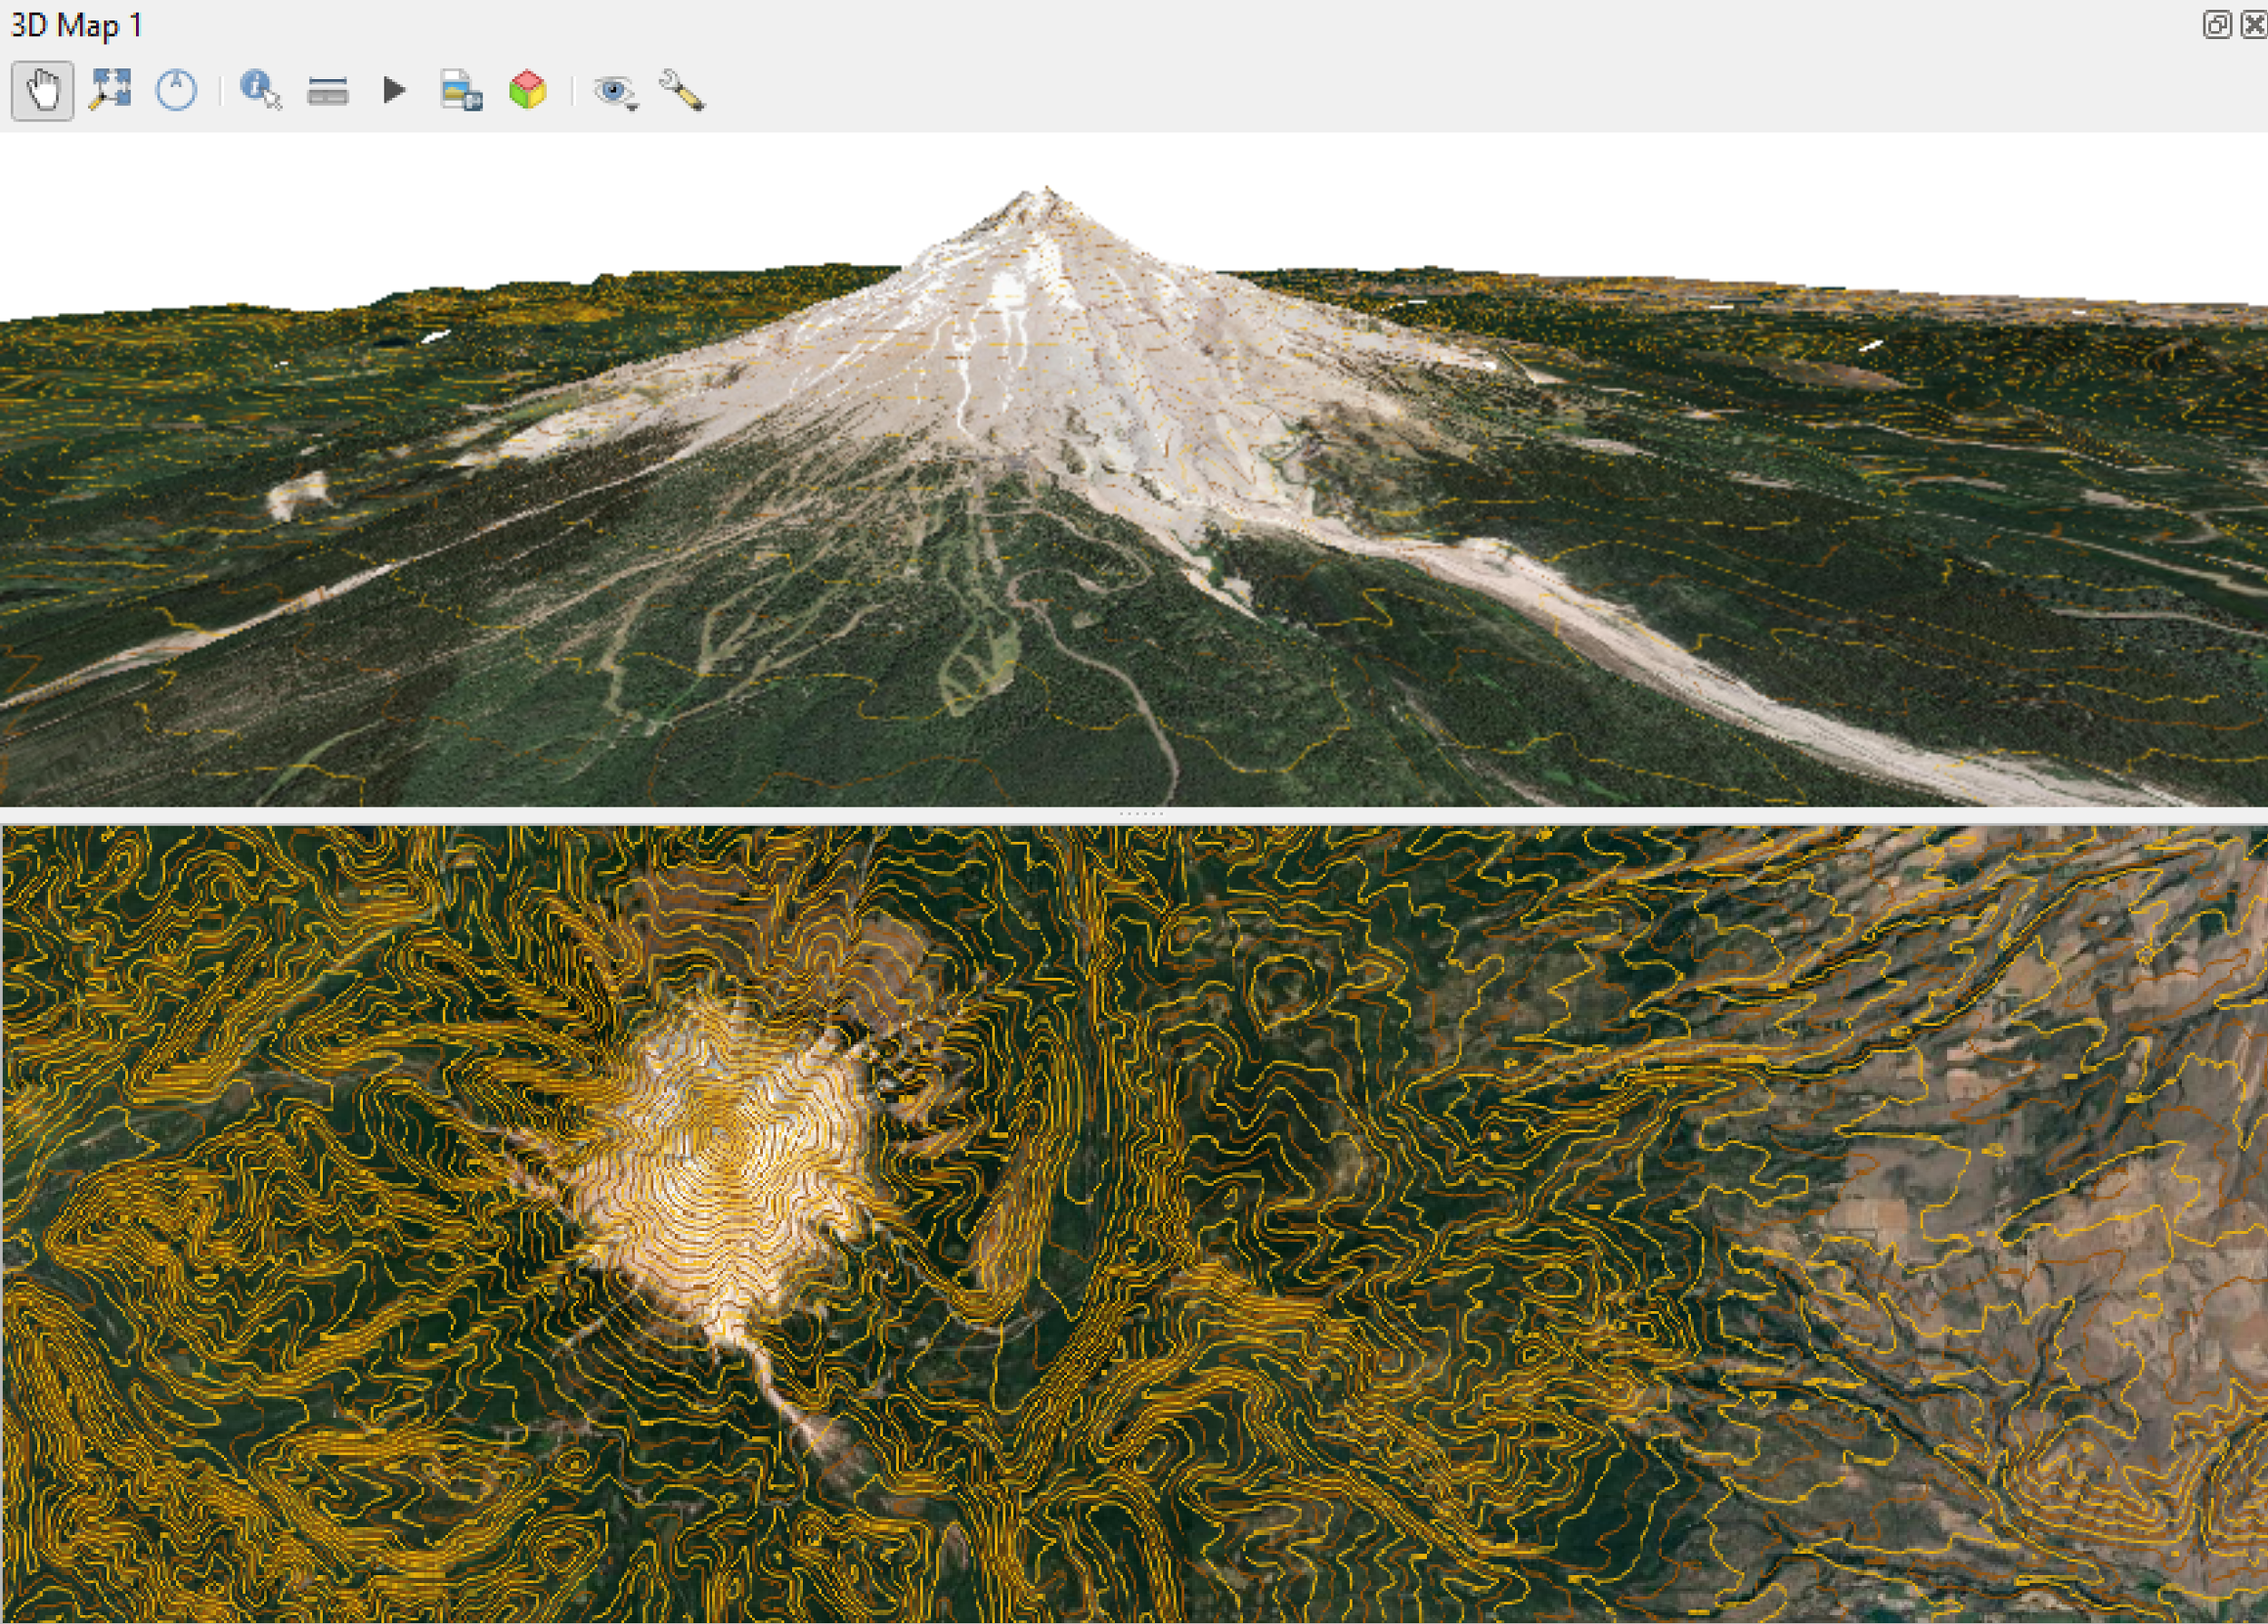
Here is an example, showing the contour rendering on top of Google aerial image in a 2D map view and a 3D map view
That’s all the tips I have for now. As always thanks for reading.