Converting ESRI Styles to QGIS XML Using SLYR

This is a follow up to my previous post on converting ESRI/ArcGIS styles and symbology for use in QGIS. Thanks to Tom Armitage for reminding me of Nyall Dawson’s SLYR plugin for converting ESRI styles files to QGIS XML styles. I don’t know Nyall but want to give him a big thank you for developing such a useful tool, making it open source and sharing it. Check out Nyall’s North Road website - he has some very interesting tools in the works related to getting ESRI and QGIS to play nice with each other.

Anyway, this post is my testing of the SLYR tool to convert ESRI *.style files into QGIS XML styles. My workflow is below, and my setup is the following: Windows 10 pro OS, QGIS 3.6 and ArcGIS 10.6.1 (for access to ESRI style files).

Download SLYR Tool from GitHub

  1. Go to SLYR on GitHub and download and unzip to your hard drive.

  2. Once unzipped, copy the slyr folder to your QGIS plugins directory (e.g. C:\Users\<username>\AppData\Roaming\QGIS\QGIS3\profiles\default\python\plugins)

Fig0005.jpg

Important Note for Windows OS

For Windows OS users, you will also need to have the mdbtools installed for SLYR tools to work. This is noted on SLYR readme page. Download and extract mdbtools-win - the SLYR plugin will need access to the mdbtools, which you will do in the next step. There’s really no installation for the mdbtools-win. All you need to do is download and extract the files to your hard drive (e.g. C:\mdbtools-win) then tell the SLYR plugin where to the mdbtools are located (see step 2 below).

Activate and Set Option for SLYR plugin

  1. Open QGIS, go to Plugins menu >> Manage and Install Plugins >> Installed >> Check the box next to SLYR

Fig0006.jpg

2. In the Processing Toolbox panel (if you don’t see the panel, go to Processing menu >> Toolbox), click the Options button. In the Options window, go to Processing and under Providers, find SLYR and set the path to your mdbtools folder (that you downloaded and extracted earlier). Here, you need to tell SLYR where the mdbtools are so it can access it.

Fig0008.jpg

Convert ESRI Styles to QGIS XML

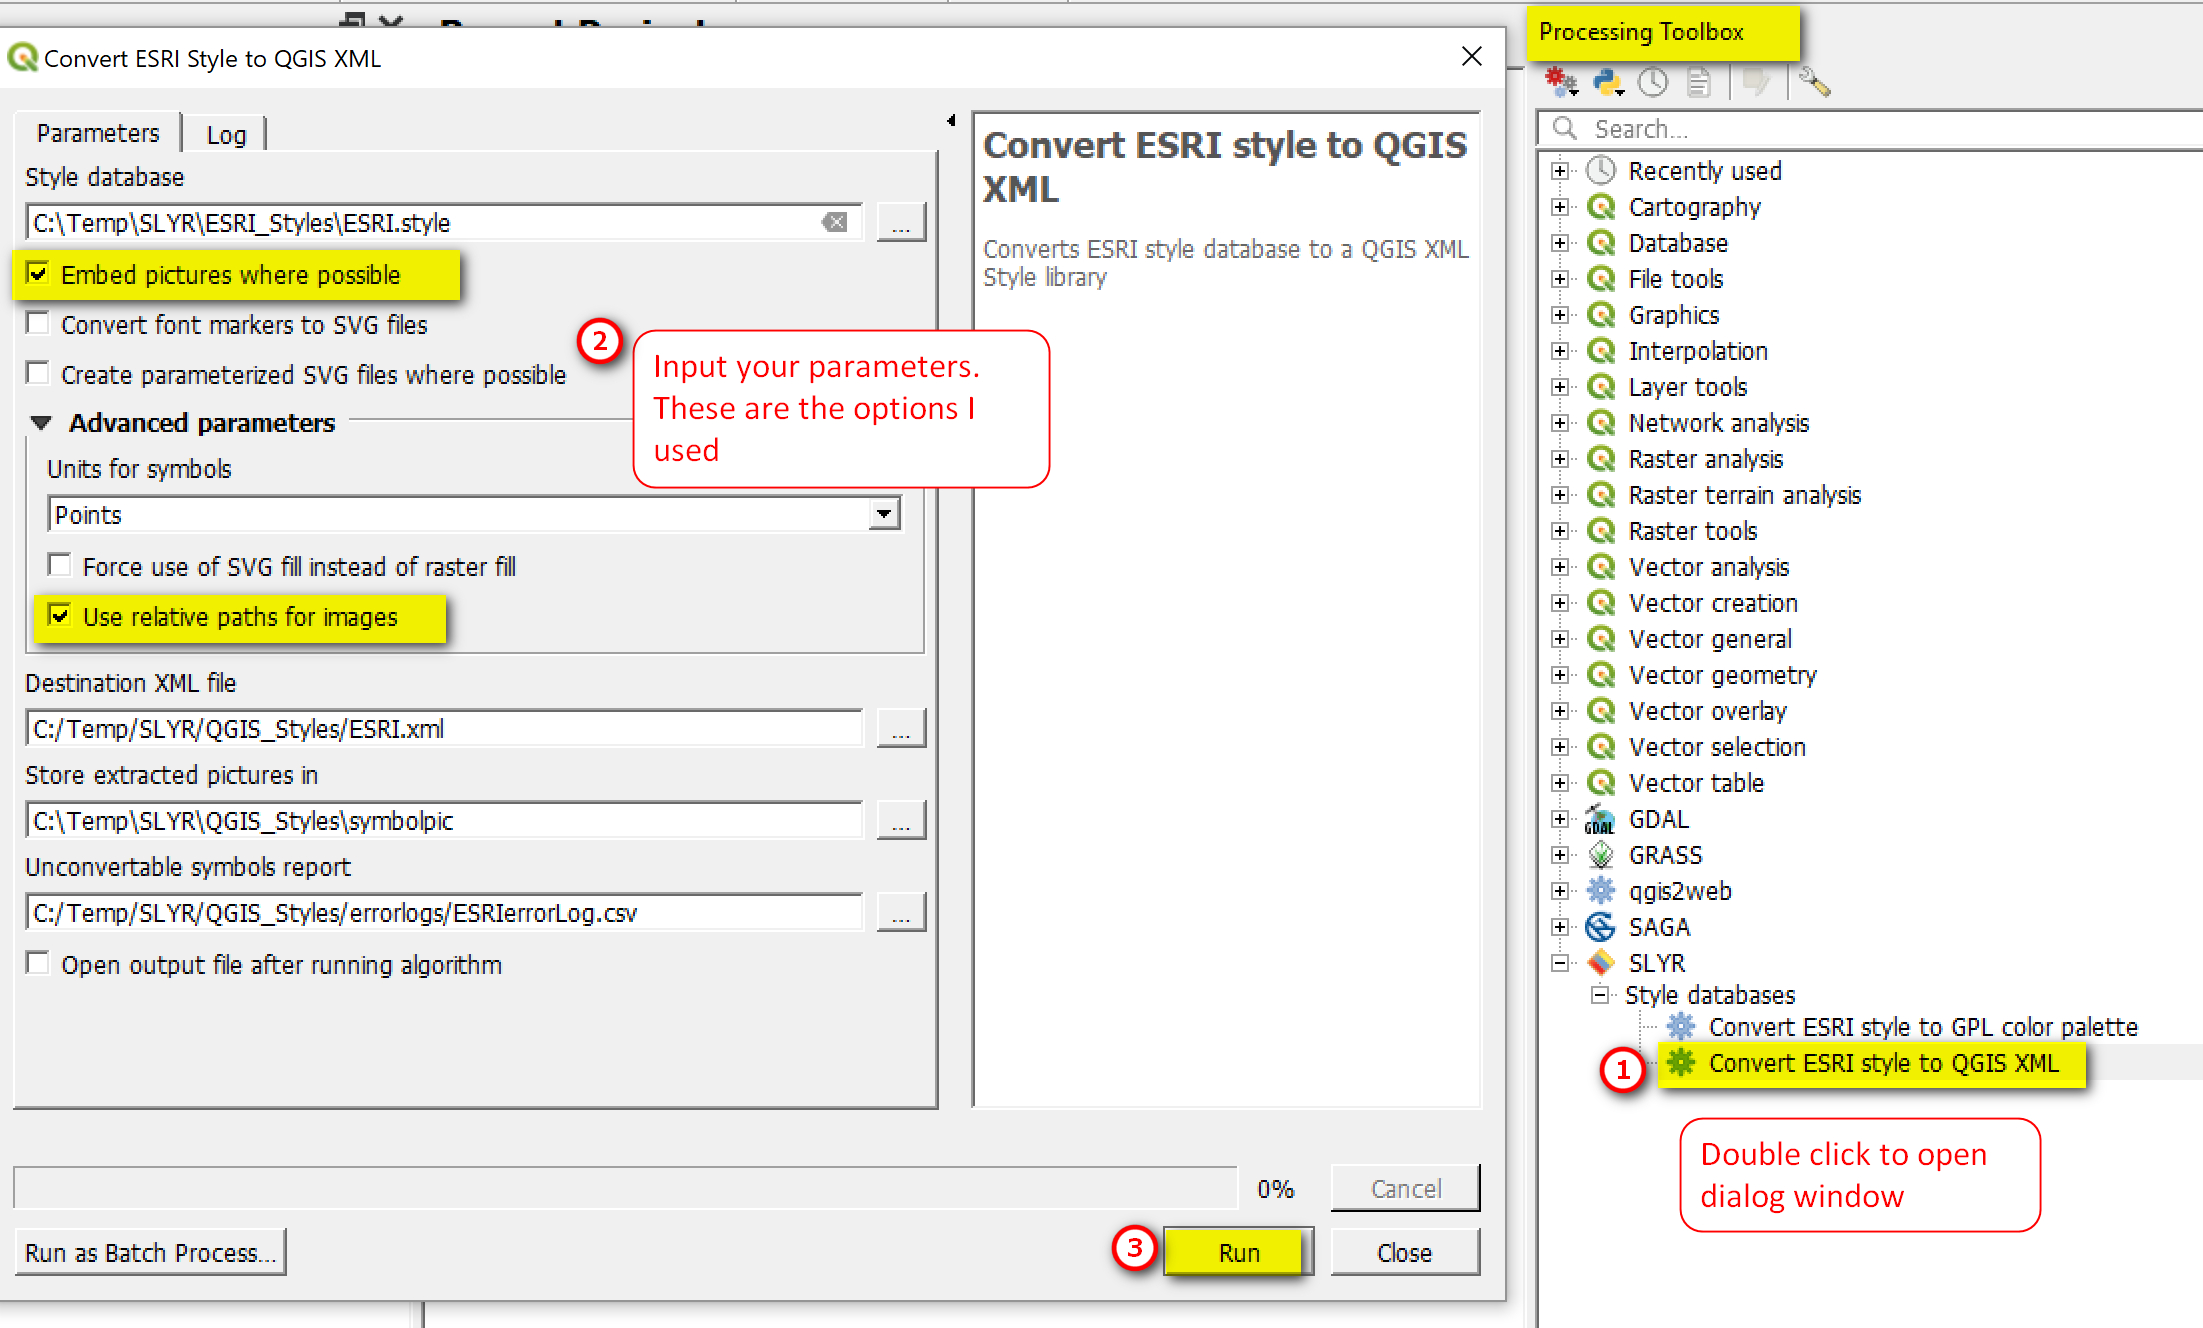
  1. In the Processing Toolbar, double click on Convert ESRI Styles to QGIS XML to open the dialog window

  2. In the dialog window: Input your parameters. Below are the options I used.

    Note: I tried the SVG options and it seems to convert ok. But when I try to open or view the svg files I got “attributes construct error”

Fig0009.jpg

Here’s a look at the converted pictures as pngs and error log (saved as csv) for symbols that couldn’t be converted

Fig0010.jpg

Import the Converted QGIS XML into QGIS Style Manager

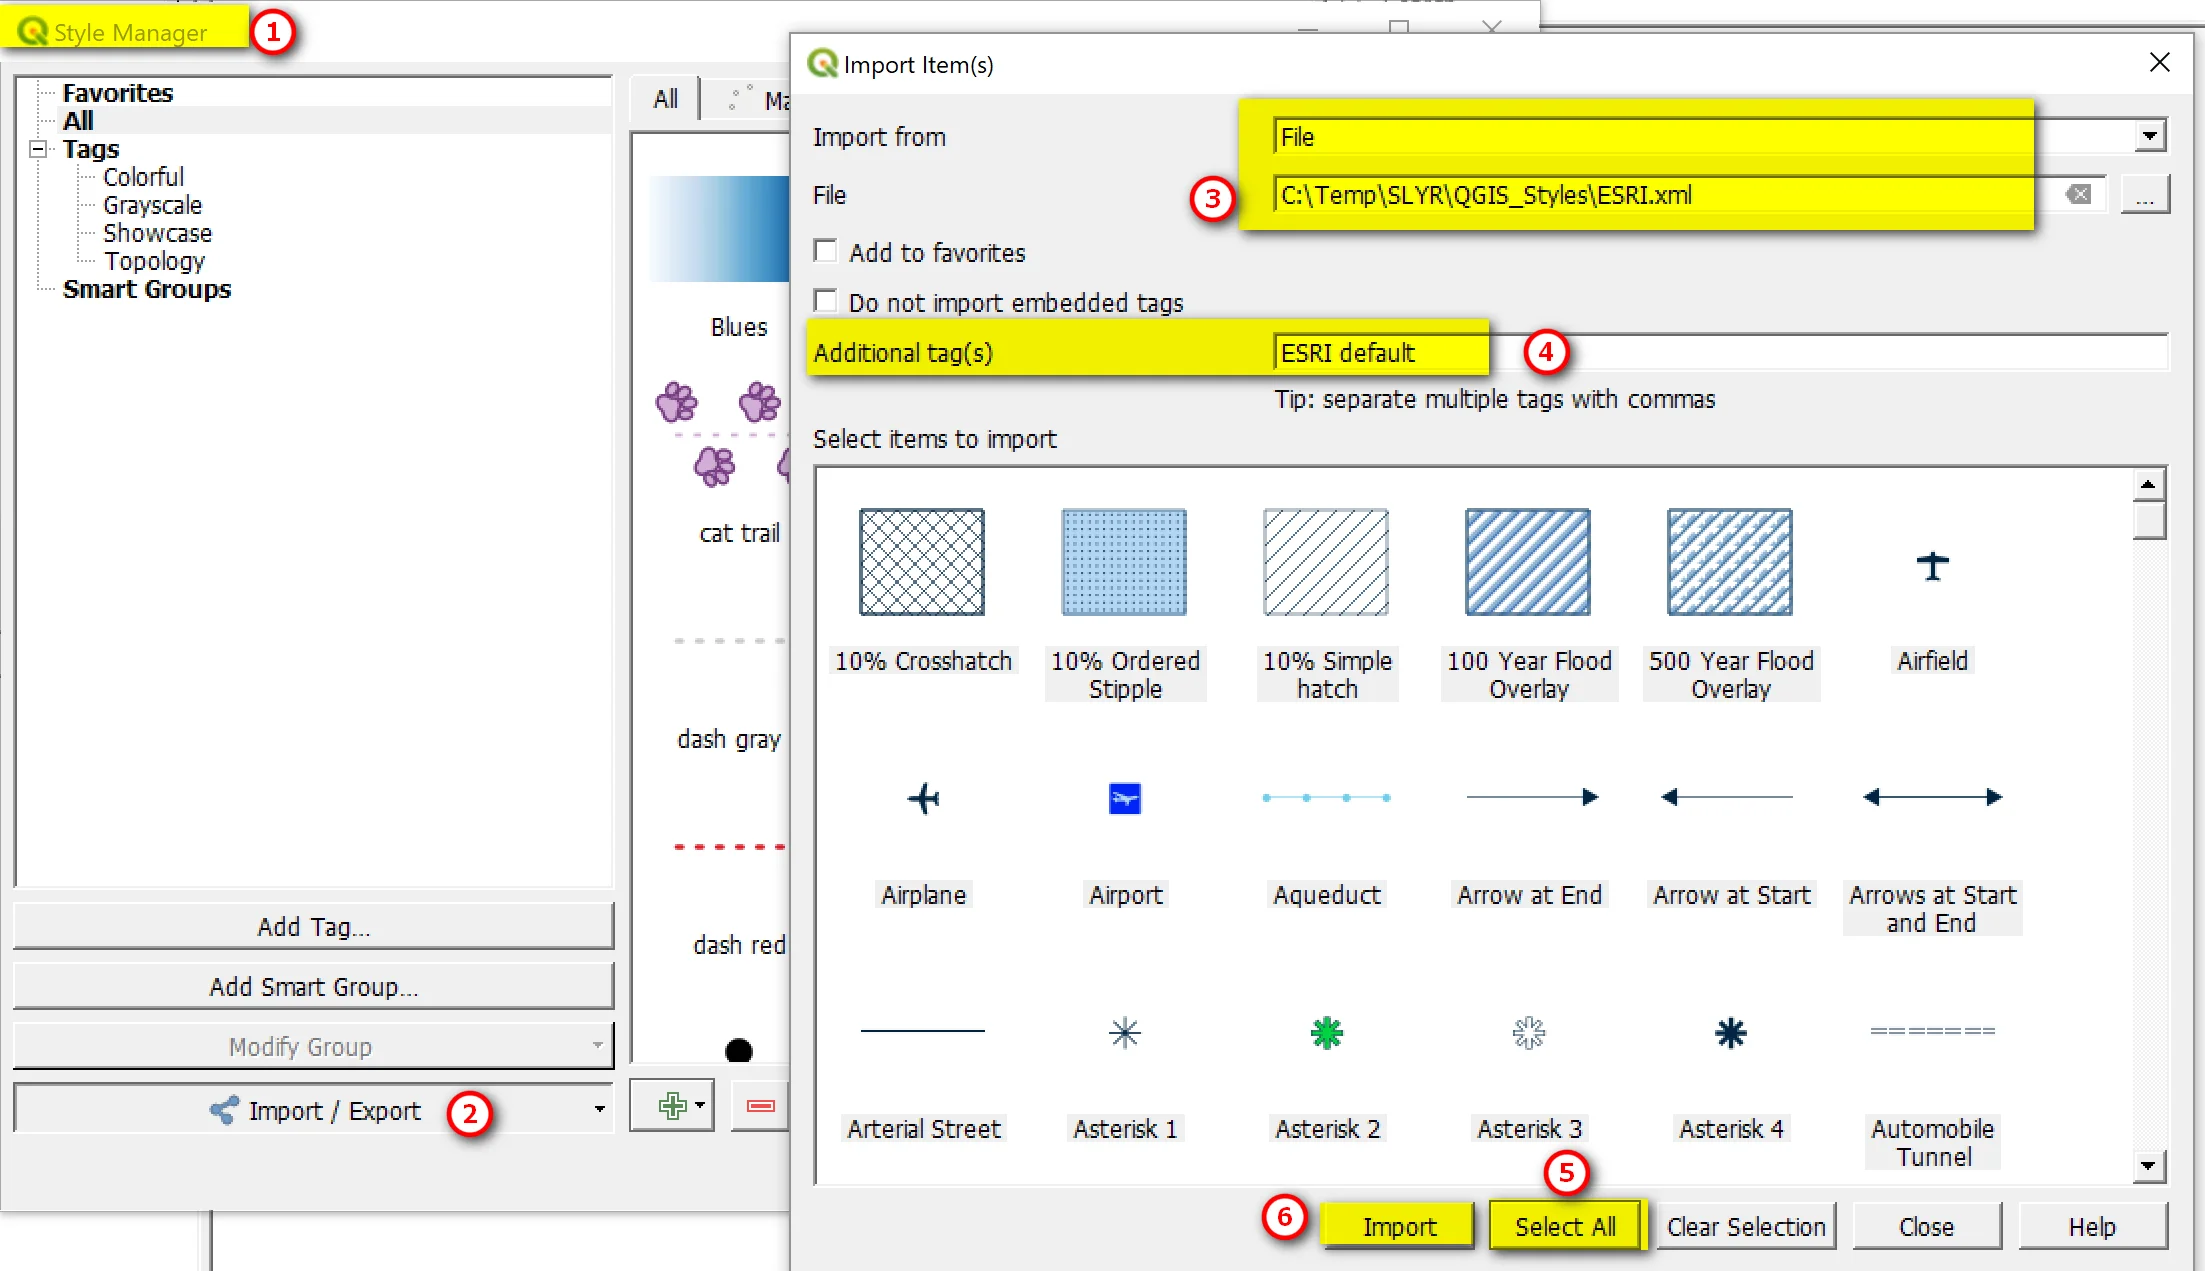
  1. Open QGIS style manager (Settings >> Style Manager) >> Import from File >> import the converted *.xml (e.g. ESRI.xml). Optionally, add additional tags. Then Select All Symbols >> Import

Fig0011.jpg

Here’s a look at what the ESRI.xml file look like - ESRI Default Markers

Fig0013.jpg

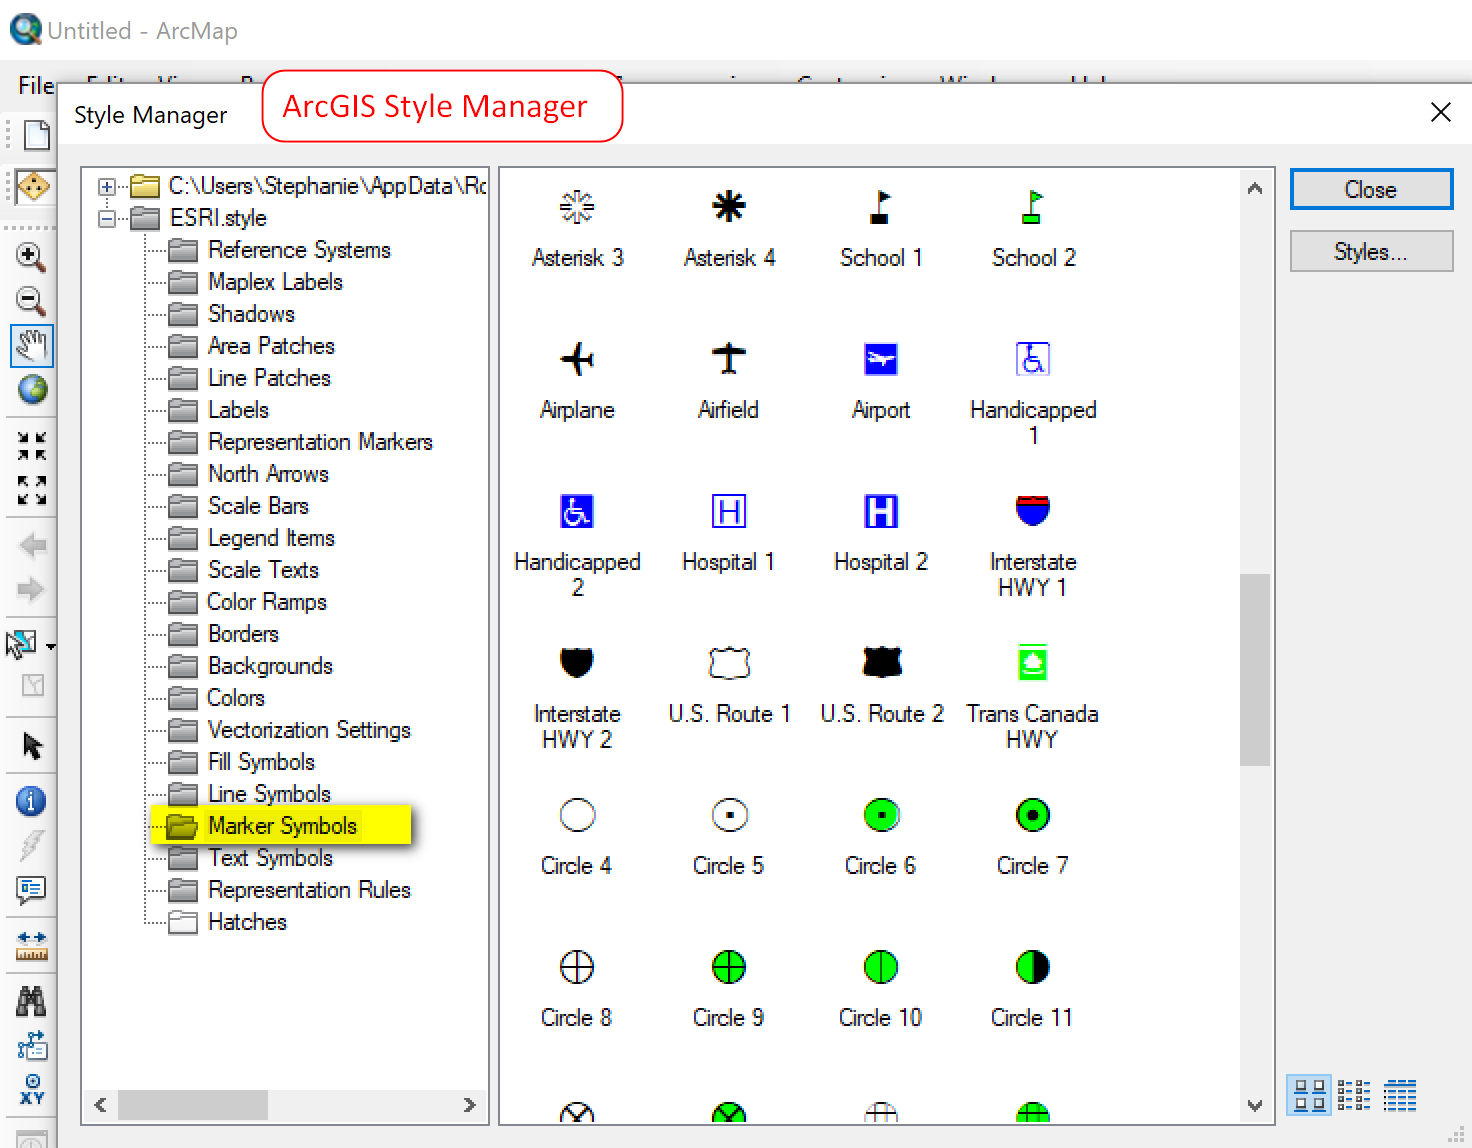
For comparison for how well the conversion worked, here’s what the ESRI.style look like. I think he SLYR tool does a great job of converting ESRI styles to QGIS XML.

Fig0014.jpg

Convert ESRI Style to GPL Color Palette

I’ve also tried the SLYR script for converting ESRI style to GPL Color Palette and it works great as well. Here’s a look at a sample.

Fig0015.jpg
Fig0016.jpg

Converting ESRI LYR to QGIS XML

You can also convert an ESRI .lyr file as well - although indirectly. You first will need to save the symbols in the .lyr file into a custom set of style (i.e. .style) before using the SLYR tool. This is what I did with the USGS TNM symbols - I created my own style file then converted them with the SLYR tool to QGIS XML.

Here’s my custom USGSTNM.style file created using the official USGS TNM map template in ArcGIS.

Fig0017.jpg

Here’s the converted style file as imported into QGIS - looks great and is exactly what I wanted.

Fig0018.jpg

Sample QGIS XML files available for download

I’ve converted some ESRI style files to QGIS XML files if anyone is interested in testing/using them. The sample styles are listed below and are available for download on my GitHub page.I make no guarantee of any kind to your use of these files.

Download on GitHub:

Fig0019.jpg

That’s it for this post. Thanks as always for reading. Until next time.

Update (4/11/2019): Brett Carlock has a converted a set of corresponding GPL files for use in QGIS. Please see his GitHub page to download the gpl files. Thanks, Brett!

Tips for Creating ArcGIS-like Symbology in QGIS

I’ve been trying hard to make the case for my team to transition over to using QGIS instead of ArcGIS, but to do that I need to come up with a compatible work flow process that would make the transition from ArcGIS to QGIS as smoothly as possible. I find the hardest part in the work flow process of transitioning from ArcGIS to QGIS is getting ArcGIS-like symbology in QGIS. The nice thing I like about ArcGIS is that it has a lot of symbology sets that comes packaged with the software so you don’t spend lots of time creating them - you can easily make a map with all sorts of industry standard symbols. Anyway, here are some of my thoughts, tips, and working process for getting/creating symbology into QGIS.

Using ArcGIS Geoportal Geoservice or REST WFS to Create Symbology in QGIS

I find that when pulling in an ArcGIS WFS or Geoservice into QGIS, it will retain the symbology set by the WFS or Geoservice. Although I’m not sure if this hold true for OGC WFS layers – or at least it didn’t work when I tried it using OGC WFS from both a GeoServer and ArcGIS OGC WFS (see example further down in the post).

For this example, I’m using data from the Hawaii Statewide GIS Geoportal site. I use data from the State’s GIS portal and the City and County of Honolulu’s site a lot. These services already have symbology that they’ve defined so I don’t have to recreate them if not necessary.

  1. Go to the Geoportal and find your data of interest. Here I’m looking at the General Plan of Kauai County. http://geoportal.hawaii.gov/datasets/general-plan-county-of-kauai

    Note: Alternatively, if you know the link to the file-base ArcGIS REST service (e.g. http://geodata.hawaii.gov/arcgis/rest/services/ParcelsZoning/MapServer) you can just use that link. But since many organizations are using Geoportal to serve their data that is what I’m going to show in this example.

  2. Click the API button drop down and copy the GeoService link – DO NOT use the OGC WFS link which will not pull in symbology set.my

Fig0001.png

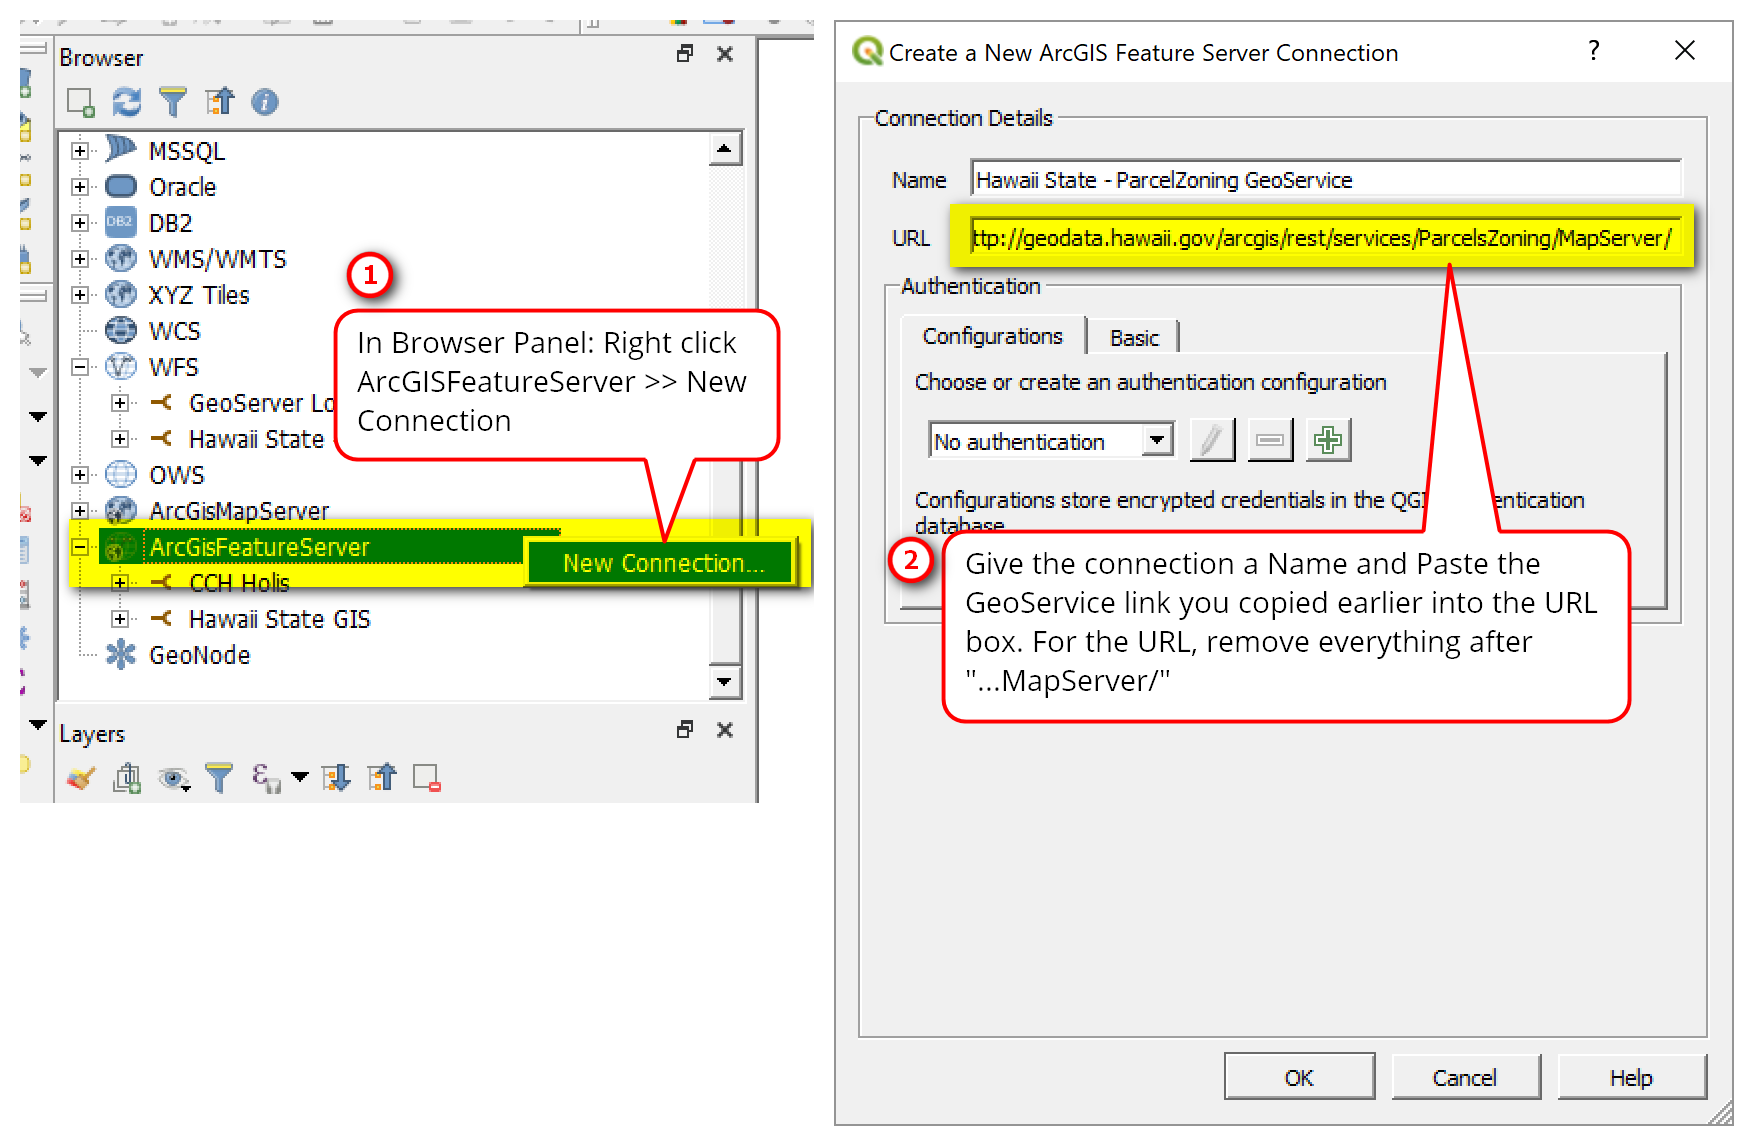
3. QGIS, Add in the ArcGISFeatureServer Connection. The GeoService that you copied will be something like this: http://geodata.hawaii.gov/arcgis/rest/services/ParcelsZoning/MapServer/7/query?outFields=*&where=1%3D1. But you’ll want to only keep the text up until “…MapServer”  and remove everything else after it. Otherwise you won’t be able to see anything layers when you add in the service.

The link to paste into the URL box: http://geodata.hawaii.gov/arcgis/rest/services/ParcelsZoning/MapServer

Fig0002.png

4. Expand the newly added service in the Browser Panel, double click on a layer to add to Layers Panel for viewing. Here I added Kauai General Plan layer.

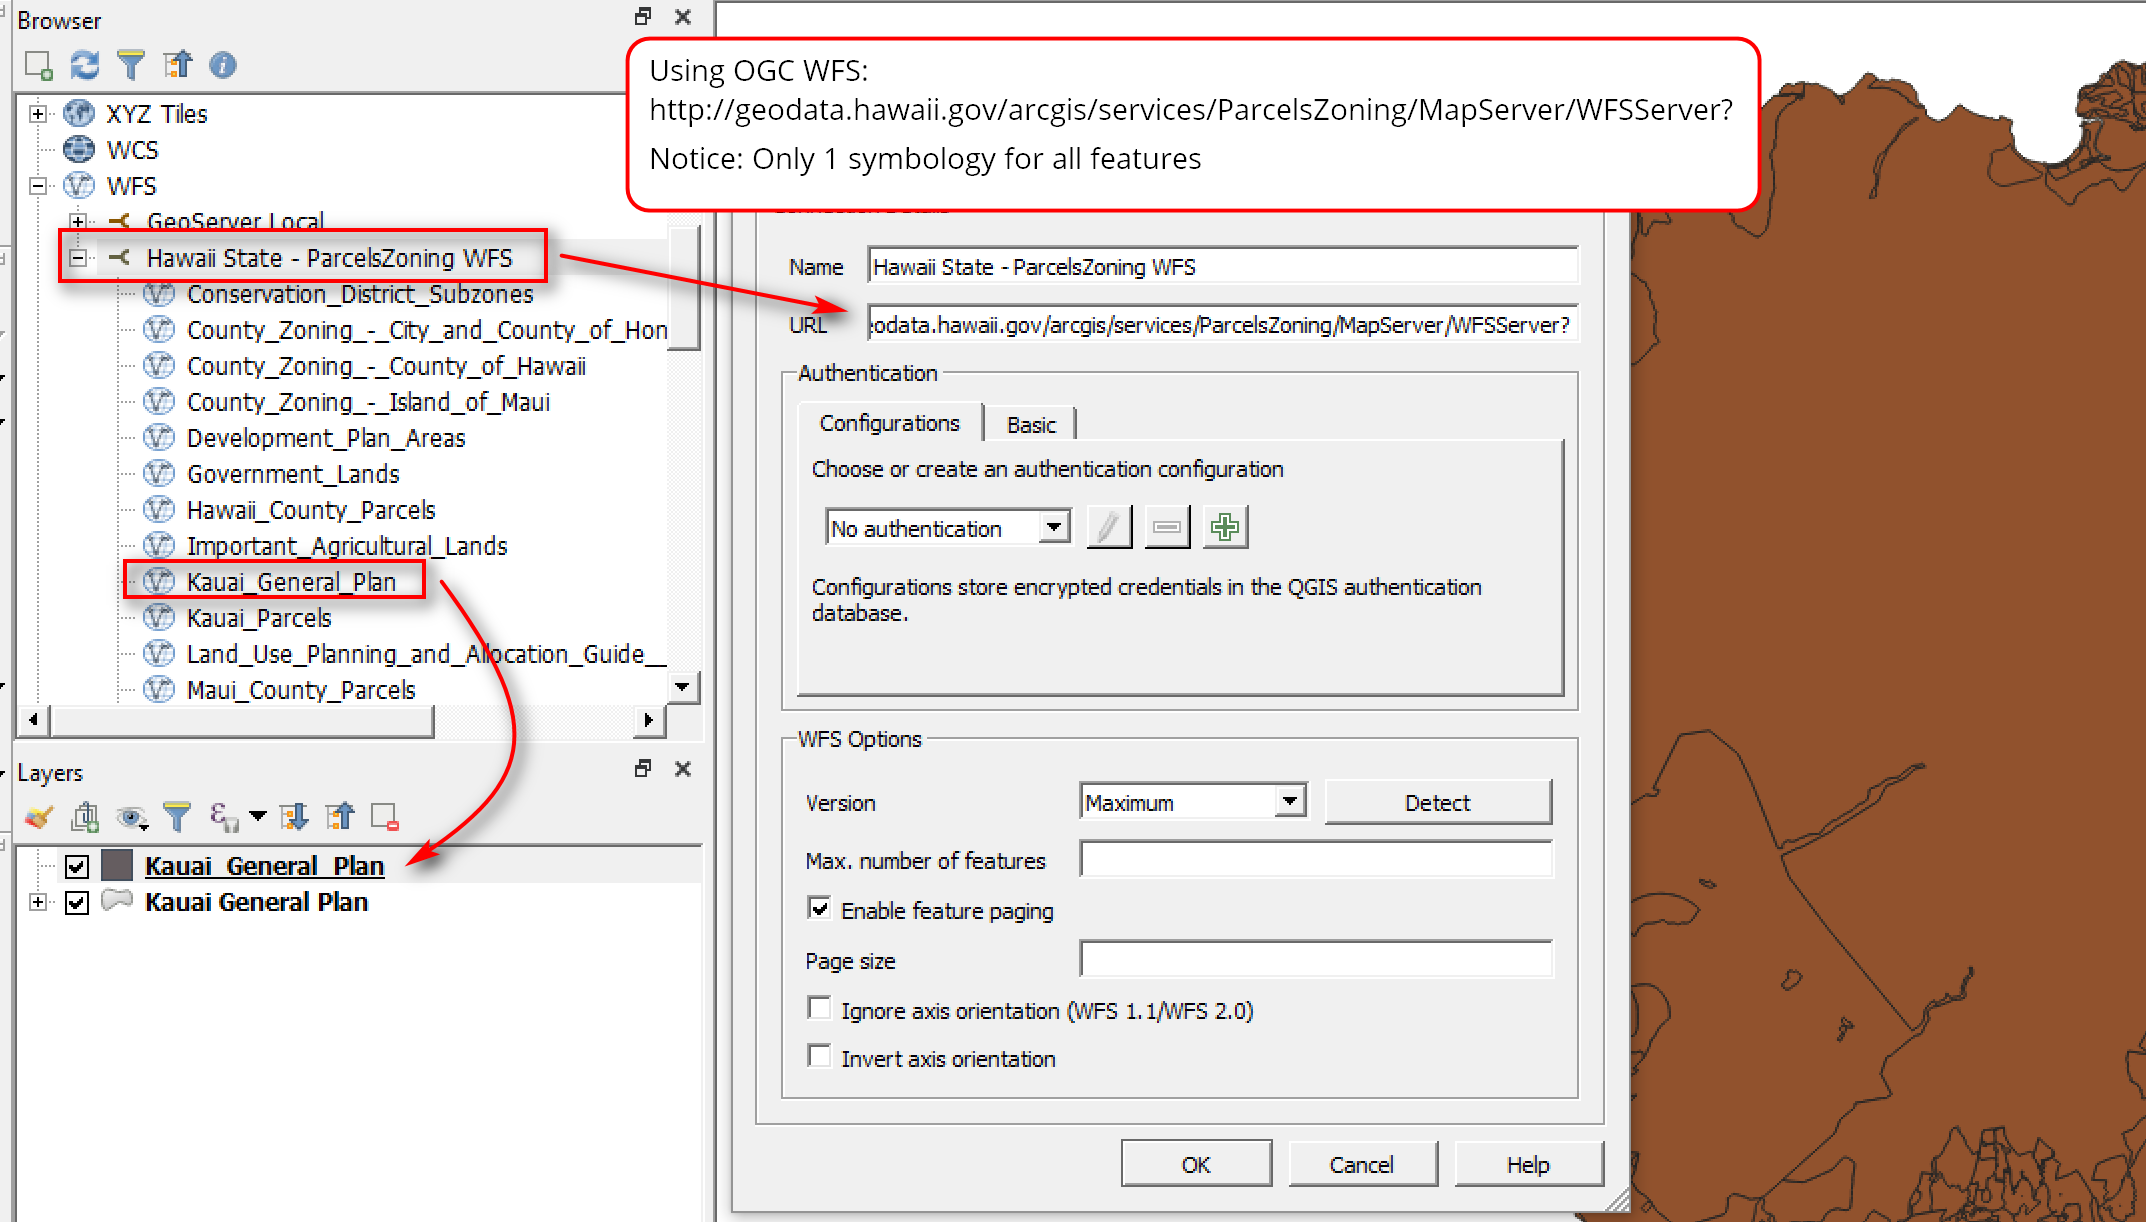
The snapshots below show the difference when pulling ArcGIS WFS (multiple categories/symbols) and OGC WFS (single category/symbol)

Fig0004.png
 
Fig0005.png

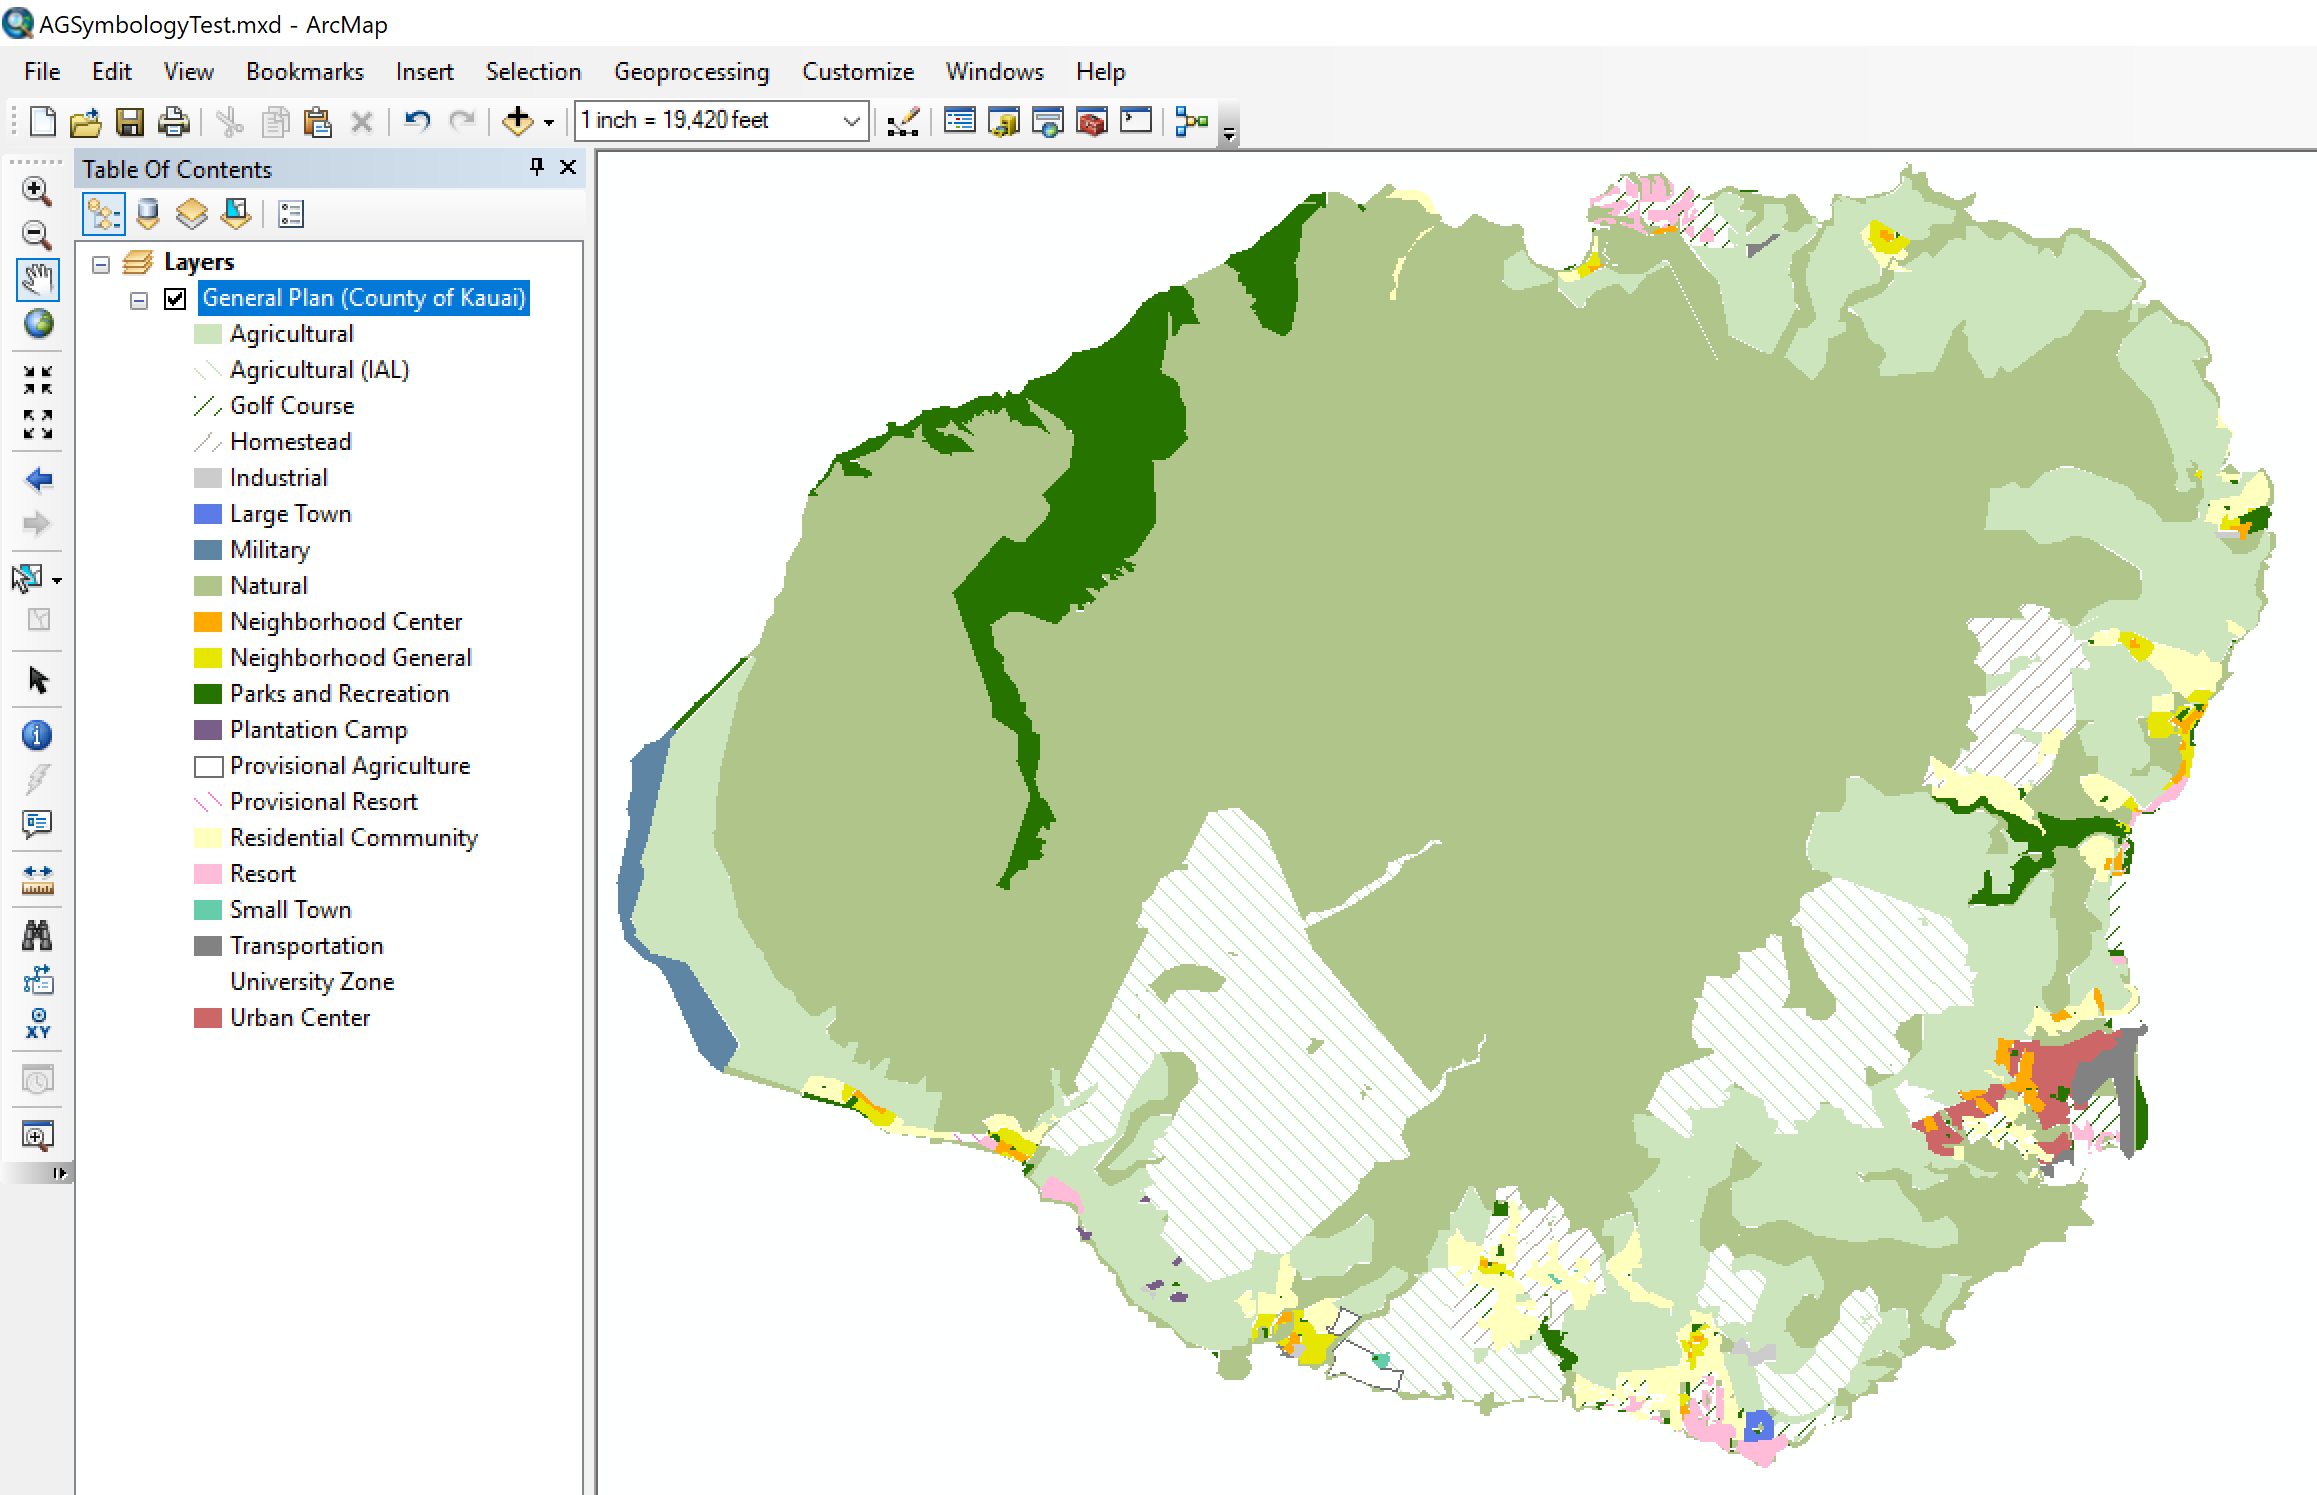
Comparisons of the ArcGIS WFS layer view in ArcGIS and QGIS. Notice that the symbology as defined by the ArcGIS WFS pulls nicely into QGIS.

ArcGIS WFS as viewed in ArcMap

ArcGIS WFS as viewed in ArcMap

Fig0007.png

ArcGIS WFS layer as viewed in QGIS

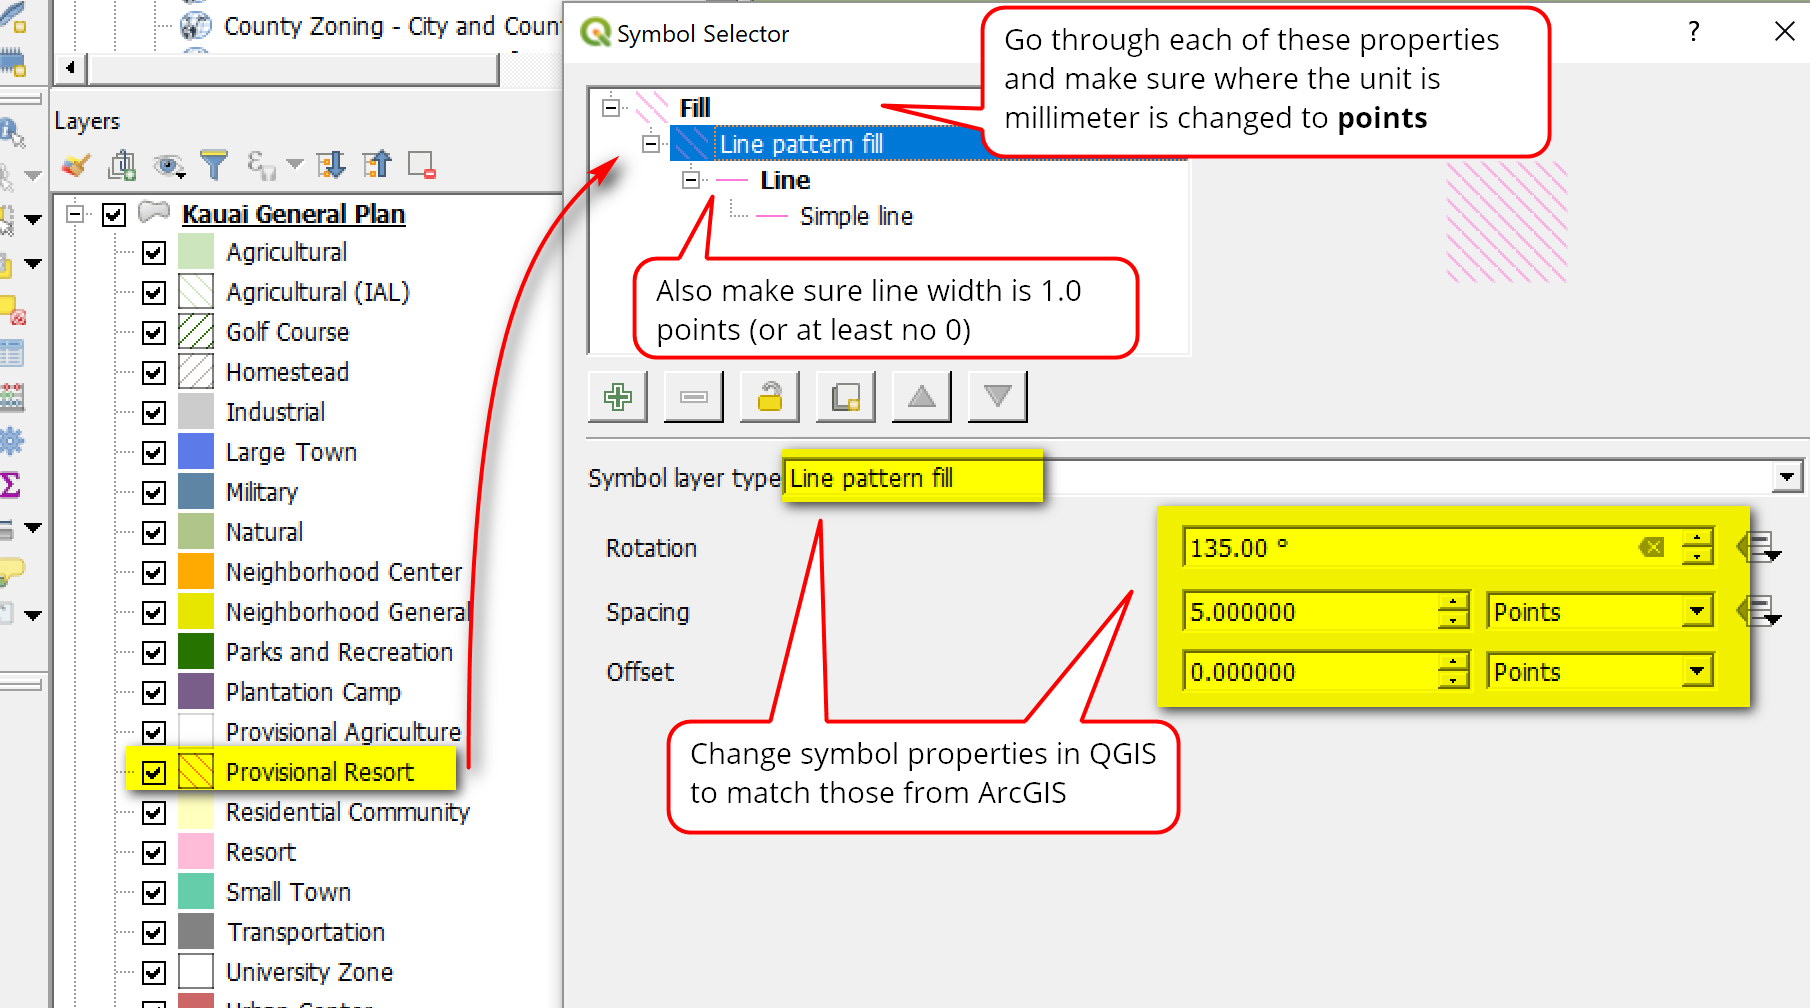
The symbology sets in QGIS and ArcMap look very similar – the solid color symbols are the same except the hatched symbols looks slightly different. You’ll need to manually fix the hatched symbols in QGIS if you want to look the same as ArcGIS. I have access to ArcGIS so I use it to see what the symbol info are then I use this same info to for the symbol in QGIS. Here, I’m changing the hatched symbol for Provisional Resort (magenta hatched symbol) in QGIS. I take note of the symbol properties in ArcGIS then I use the same info for the symbol in QGIS. So, in QGIS the symbol for Provisional Resort comes in as a simple fill, which looks like the symbol used in ArcGIS but when the map is printed or exported to pdf, it doesn’t produce the effect I want; a hatched line polygon with transparent background. So in QGIS, the simple fill should be changed to a line pattern fill symbol.

Shown below is the symbol properties in ArcGIS

Fig0008.png

This the symbol properties in QGIS - which needs to match what is seen in ArcGIS above.

Fig0009.png

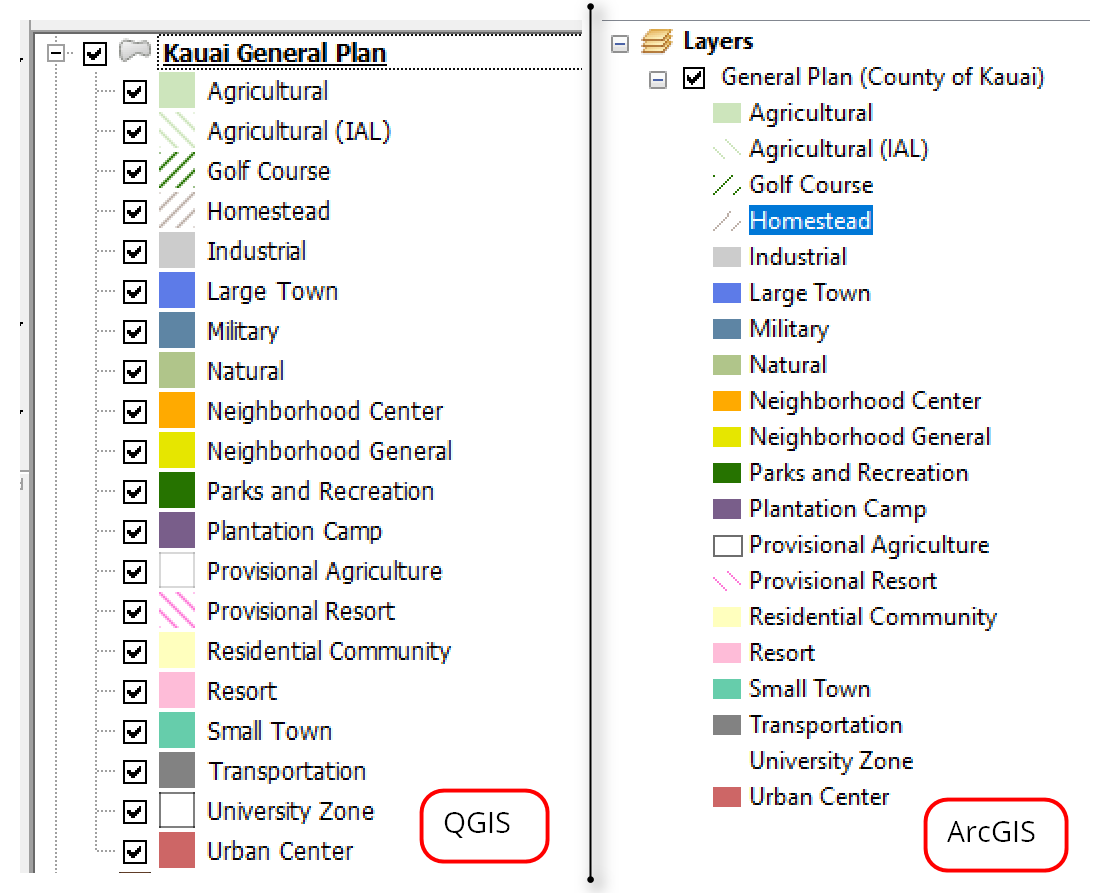
Here is a comparison look at the symbology in ArcGIS and QGIS - this is after I made changes to the hatched symbols in QGIS to match ArcGIS.

Fig0010.png

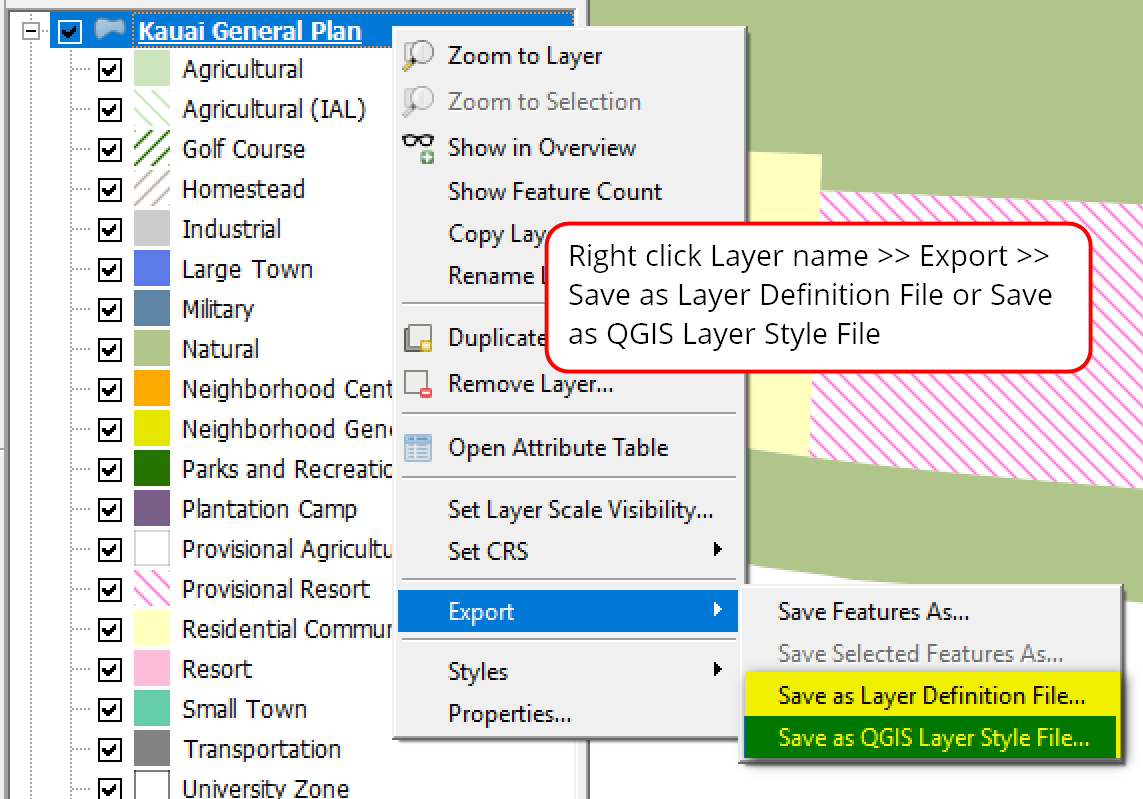
Once I have the symbology in QGIS the way I like it, then I can save it as a *qml and/or *qlr file. To do that, right click on the Layer name >> Export >> Save as QGIS Layer Style File (qml) option or QGIS Layer Definition File (qlr)

Fig0012.png

Notes on different QGIS files related to symbology

QML = only saves symbology styles

QML files save style information including labels from a layer if you have them. It doesn’t contain reference to the layer source. You can use a qml file on your own copy of the dataset. QML files can only be applied to a layer once it has already added to QGIS.

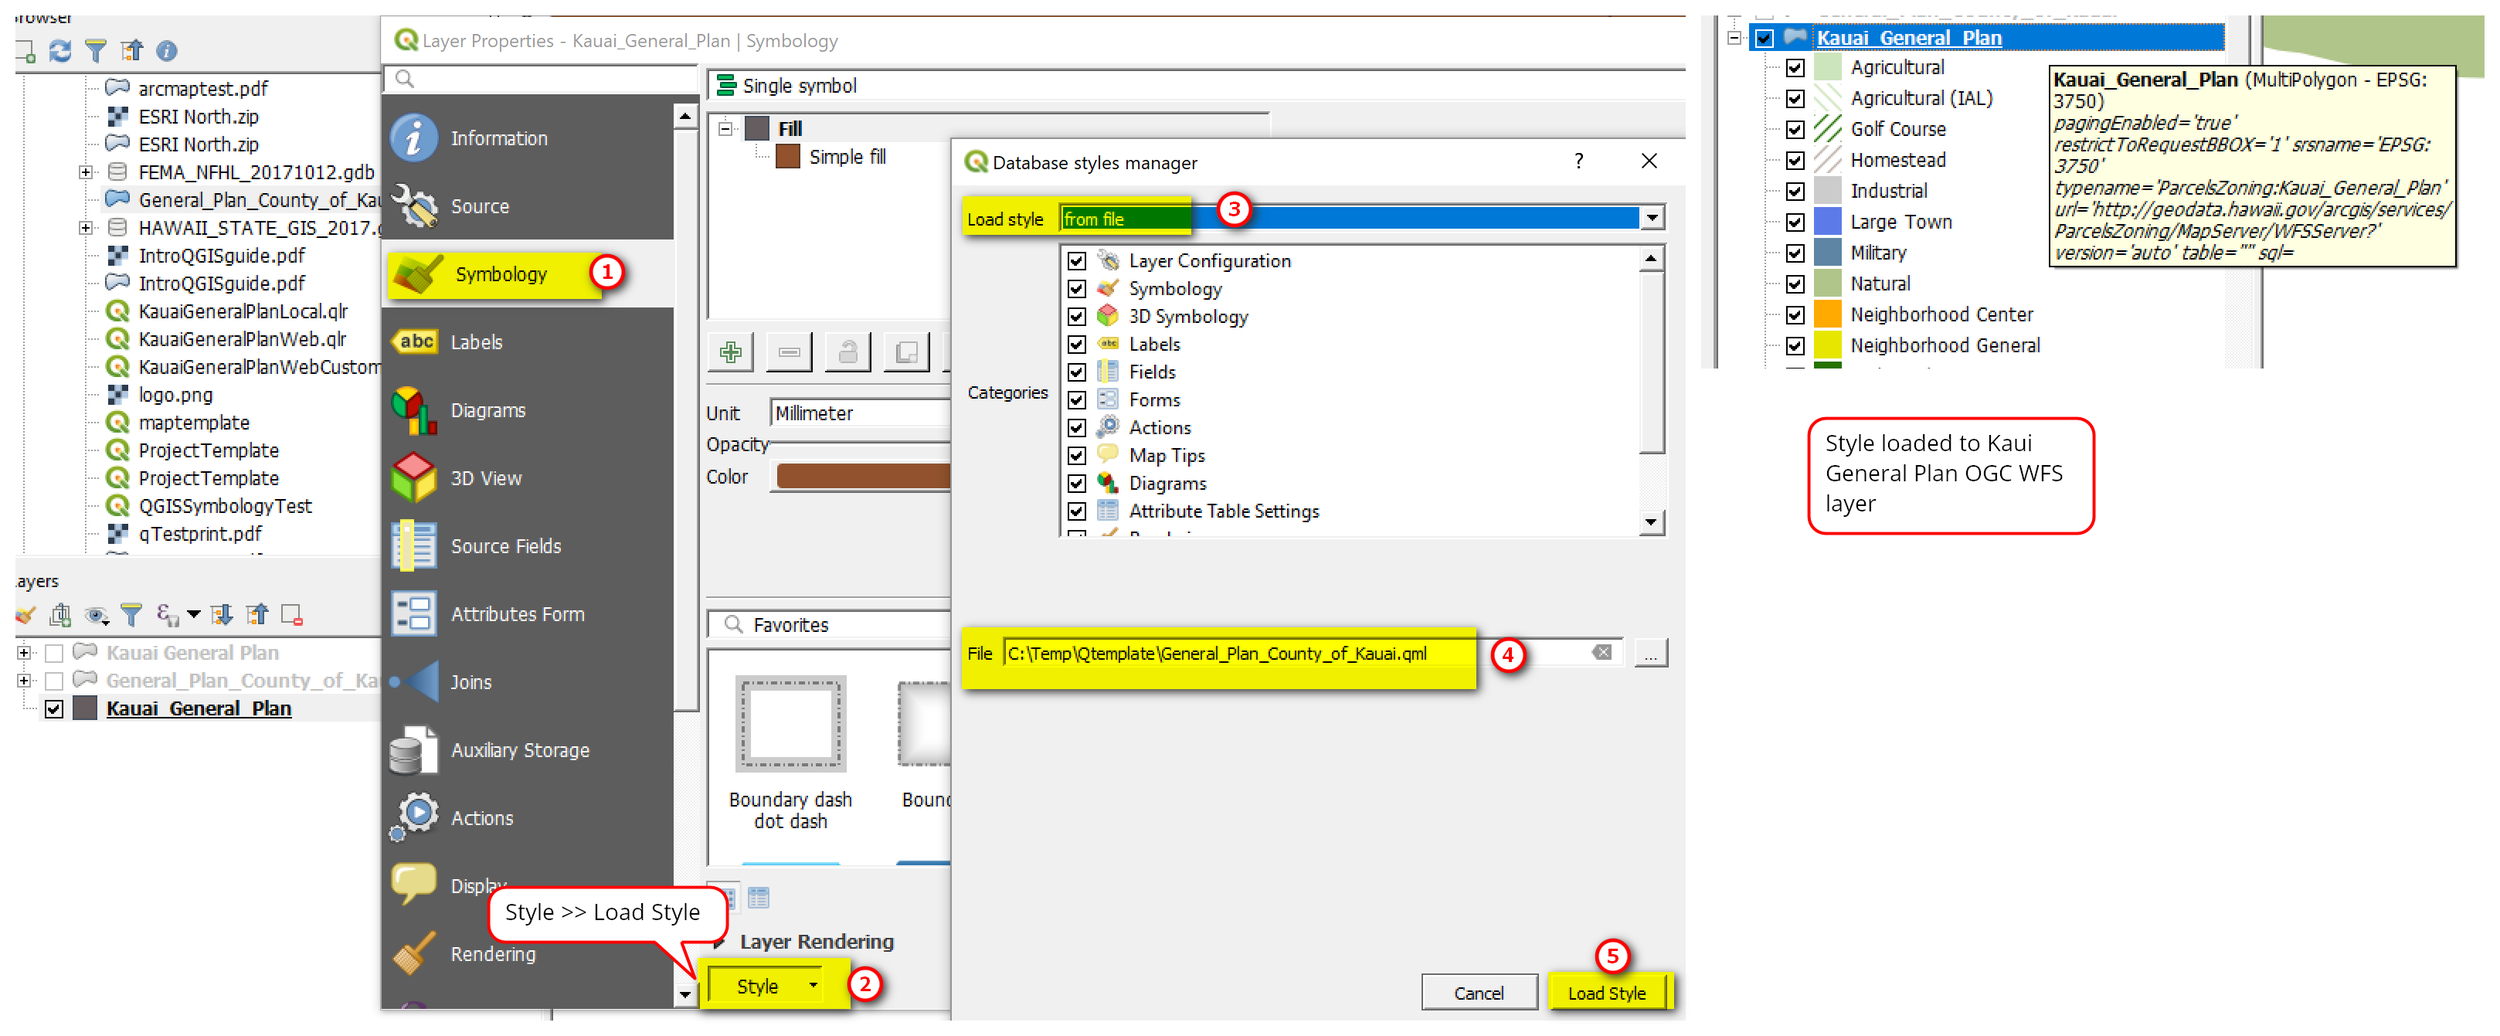
To use QML files you need to add the data layer first to QGIS then Load Style for the layer. It works for shapefiles, OGC WFS layers, and feature classes from a file GDB (I’ve tested on my machine and it should work but can’t guarantee).

TIP: if you have a shapefile and *qml file saved in the same location with the same layer name then QGIS will automatically use the corresponding qml style as the default for the shapefile.

Fig0013.png

QLR = Source + symbology

The qlr option saves the link to the data source and the style/symbol information. I tend to think of *qlr as equivalent to ArcGIS’s *lyr file. QLR files are added in QGIS by going to Layer menu >> Add From Layer Definition File

Here is an example of applying qml file to an OGC WFS layer – if you remember from above the OGS WFS layer for General Plan Kauai County was pulled into QGIS with only 1 symbol/style.

Fig0015.png

Bonus: USGS Topo TNM Styles from ArcGIS Recreated in QGIS

Since I’m talking about creating or rather re-creating ArcGIS-like symbology for use in QGIS. Here is a bonus. I really like the USGS TNM maps for references and use the USGS TNM Style Template in ArcGIS at lot – see the ArcGIS Template (map document or mxd file) provided by USGS - See post here for background. But there’s no equivalent for QGIS. So, here I try to recreate the styles for use in QGIS. I haven’t worked on the labeling yet. I could use the USGS TNM WMS service in QGIS but it doesn’t provide the high resolution I need, so I’d rather use the vector dataset. Also it gives me more control on what features I show and how I symbolize them.

This workflow requires having access to both ArcGIS and QGIS and basically is comparing and translating the symbol property information from ArcGIS to QGIS. It is time consuming but worth it to get something decent for use in QGIS. Below is the workflow process I used – it is still a work in progress. I’m using the Honolulu 7.5 minute quad as an example here. Also note I’m directly accessing the GDB in QGIS.

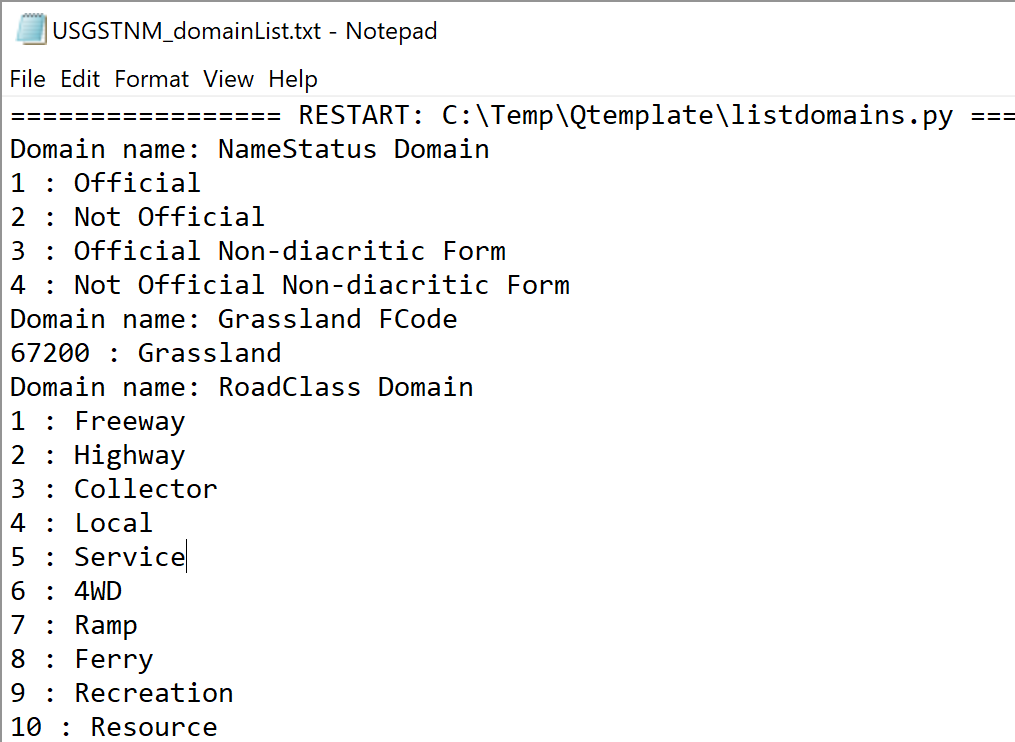
  1. Optional - In ArcGIS, I run a python script to get list of Domains for the USGS Vector GDB. Think as Domains as basically coded look up tables in the GDB, and I use this for reference to help me recreate the symbology in QGIS. There are also subtypes in the USGS GDB as well, but I didn’t bother to get these listings.

Here’s an example domain list for VECTOR_Honolulu_HI_7_5_Min_GDB.gdb

Fig0023.png

2. Open USGS TNM style template (e.g. TopoTNMStyleTemplate_v10_01.mxd) in ArcGIS set the data source link to the staged vector GDB of interest (I’m using VECTOR_Honolulu_HI_7_5_Min_GDB.gdb).

3. Open up the Symbology properties window for each layer – take note of how the layers are symbolized so you can re-created them in QGIS

Below is an example for the Structures layer as categorized in ArcGIS.

Fig0024.png

4. In QGIS, add the data layers from the same GDB. Put them into groups if needed. Then start symbolizing the layers:

Here is the same example of the Structures layer by categories or rule-based categories in QGIS.

Fig0025.png

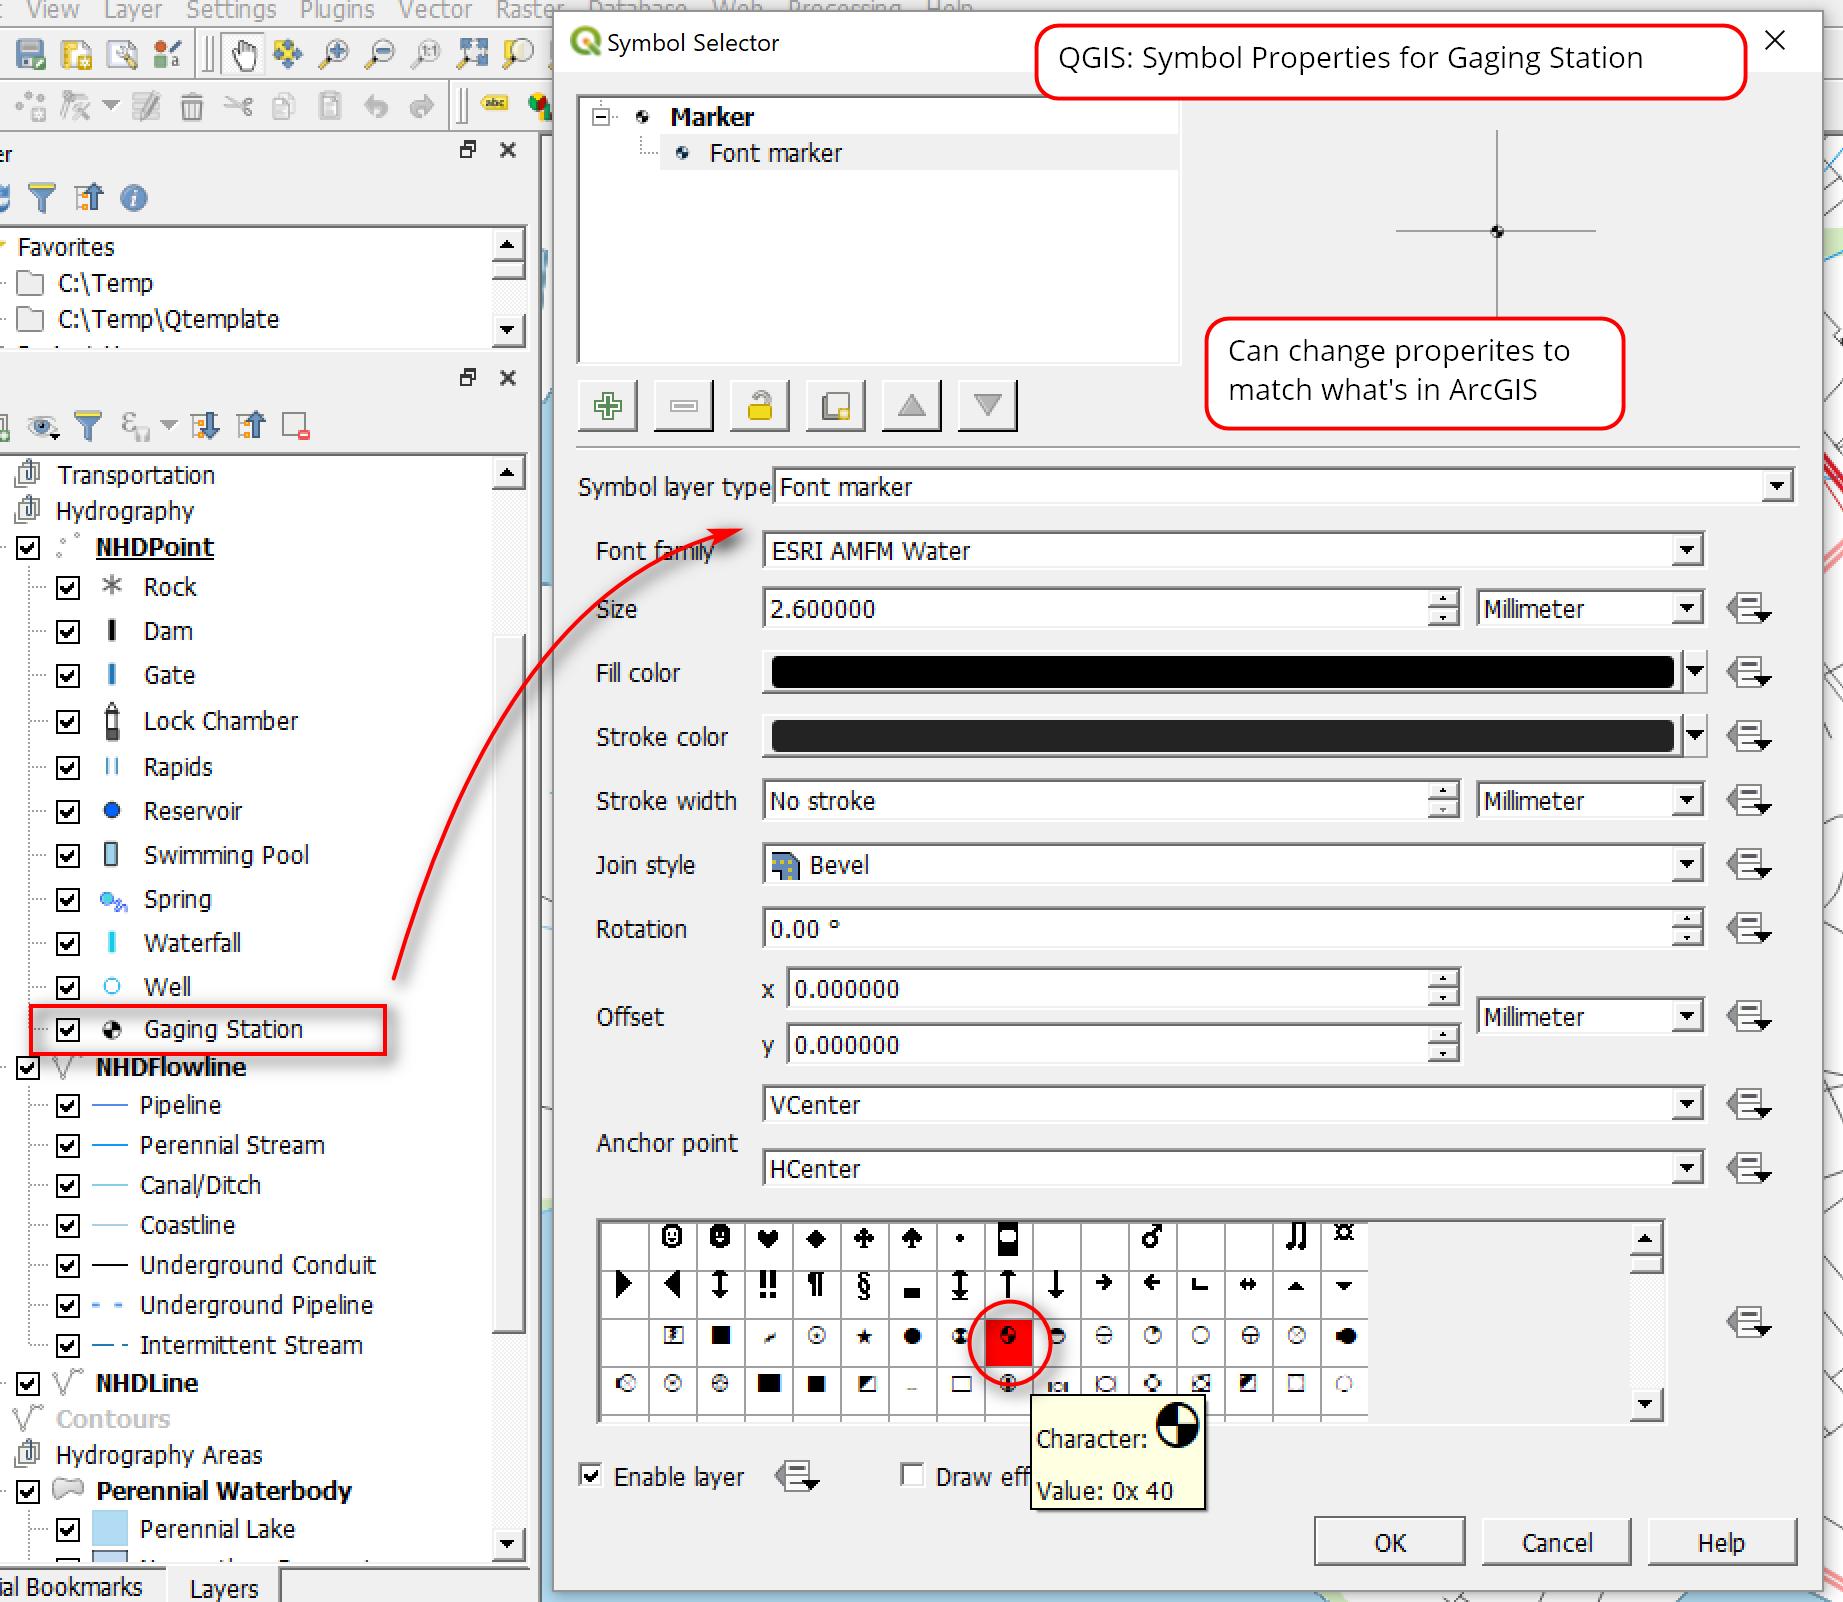
Tip: For symbols that use ESRI Fonts, I try to use the same font symbol in QGIS, since I have ArcGIS installed on my machine – see snapshot below. But this may not work if you don’t have access to ArcGIS.

Fig0021.png
Fig0022.png

Here’s a look at the USGS TNM Style in ArcGIS

Fig0016.png

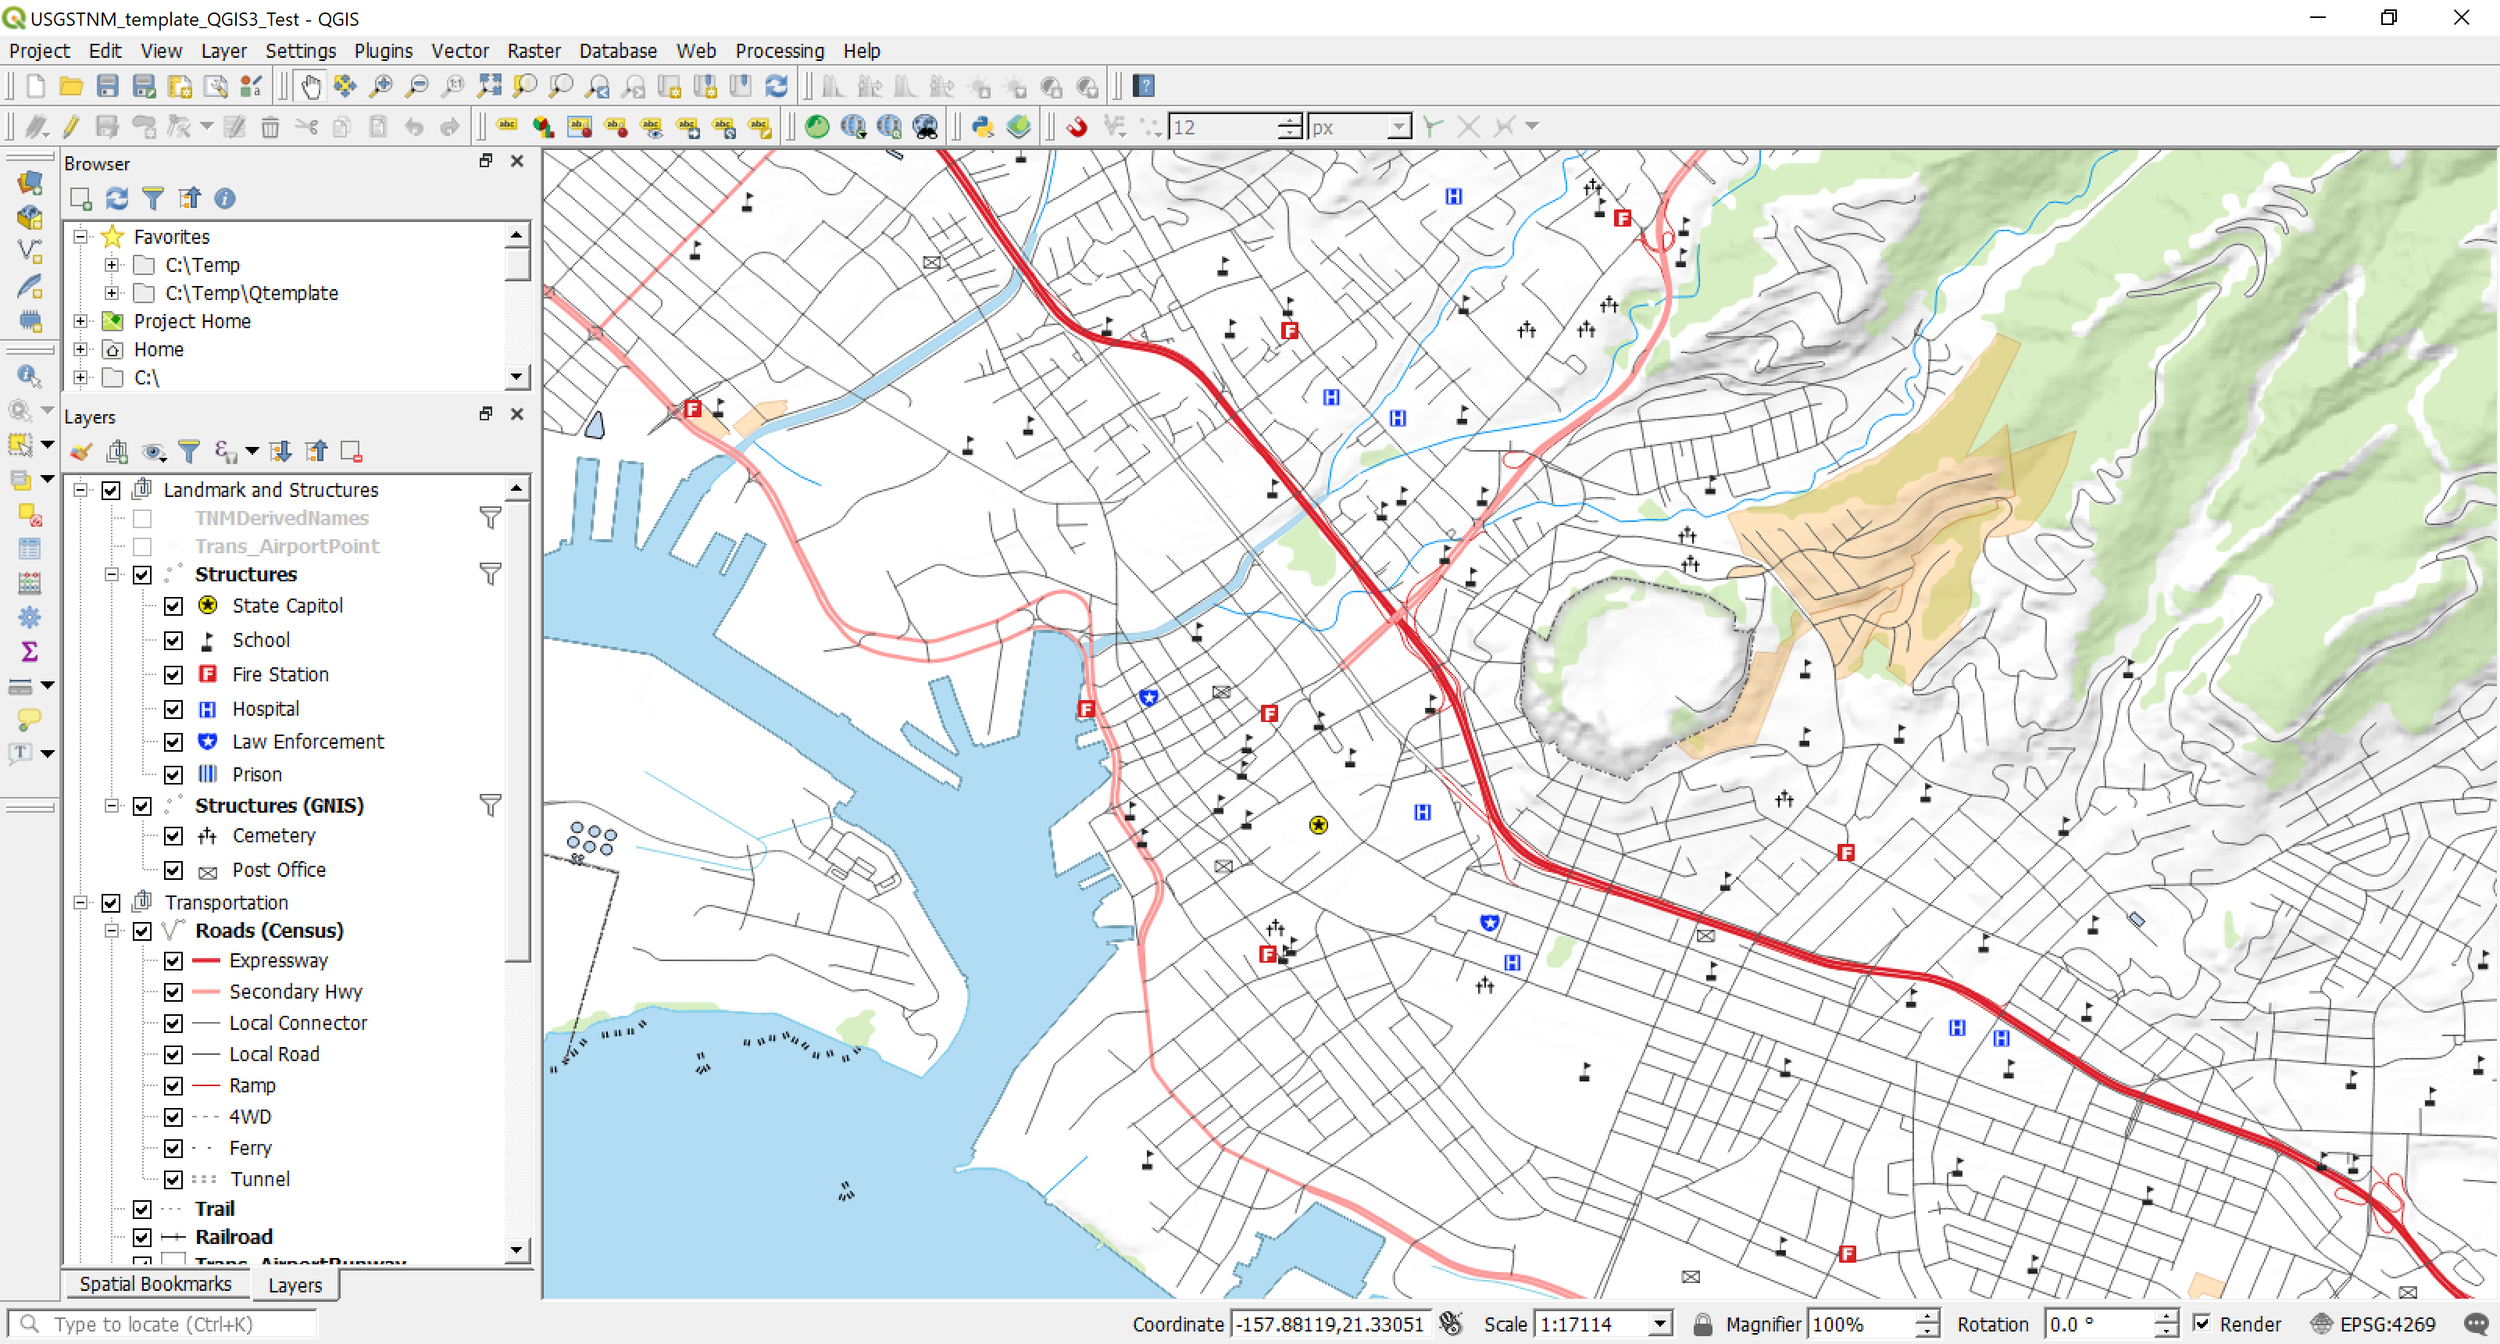
Here’s what it looks like in QGIS. I think it looks pretty good.

Fig0017.png

Creating and Using a QGIS USGS TNM Style Template

Creating a QGIS project template is as easy as saving the QGIS project as a *.qgs file and putting it into the QGIS Project Templates folder. So, that’s what I did - saved my QGIS USGS TNM Style map as a QGIS template. QGIS 3.x saves the project to the default .qgz file so I do a “Save As” to are non-compressed QGIS project file .qgs file. Then I copy and paste the *qgs file into the QGIS Project Templates folder (e.g. C:\Users\Stephanie\AppData\Roaming\QGIS\QGIS3\profiles\default\project_templates).

To change the project template file to use a different dataset, just open the *.qgs file that is in the Project_Templates folder (e.g. C:\Users\Stephanie\AppData\Roaming\QGIS\QGIS3\profiles\default\project_templates) in a text editor (e.g. Notepad++) and find the old data path and replace with your new data path - see example below. Save this file when done. For my example, I downloaded a USGS Vector GDB file for San Rafael, CA quad (e.g. VECTOR_San_Rafael_CA_7_5_Min_GDB.gdb). You can download the staged USGS vector datasets directly by State from here.

Fig0026.png

Open a new or blank QGIS project >> Project Menu >> New from Template >> Select template file to open (e.g. USGSTNMtemplateQGIS3_Draft.qgs

Fig0027.png

After opening the file, it should look like the following. If you don’t see anything on your map, you may need to zoom in to a layer (i.e. click on a layer >> Zoom to Layer). The snapshot below shows the San Rafael, CA topo quad. Note, also you’ll need to change “Hawaiian Homelands” layername to Native American Lands. Also, some layers may not contain any data if they are not available for that particular quad.

Here is what the USGSTNMTemplateQGIS3_Draft QGIS project template file opened with San Rafael GDB applied. Note that I’ve included a USGS WMS for shaded relief and imagery in the template.

Fig0028.png

Bonus Tip: Trick to getting a WMS or WFS to show up in a Print Layout - you may need to have all layers in the same coordinate system (CRS). WMS and WFS are usually in CRS 4326, so try re-projecting your data layers into the same CRS if they are in a different CRS. QGIS can do projection-on-the-fly so you can see all layers in different CRS in the map view but not in print layouts.

Download Files Available

A copy of the QML files and QGIS project files can be downloaded from my GitHub page if you want to see if the styles will work for you with your own dataset.

Download files: https://github.com/StephSaephan/QGIS-USGS-TNM-Style-Template

FILE USAGE INFO:
Access to both ArcGIS and QGIS may be needed for the style files to work properly in QGIS.I have ArcGIS 10.6.1 and QGIS 3.4.3 installed on my machine when I created the QML files, so I'm not sure if it will work in QGIS if you don’t have access to ArcGIS.

The QGIS project file, USGSTNM_Template_QGIS3_Draft.qgs can be use as a Project Template file. Copy this file into the project_templates folder (e.g. C:\Users\Stephanie\AppData\Roaming\QGIS\QGIS3\profiles\default\project_templates). Then open this qgs file in a text editor and find/replace old data path with new data path (e.g. your own GDB). See the blog post for reference on how to do this.

If using the QML files individually, please read the note below. Notes on QML files for filtered data layers: The QML files that contain filtered data may not pull in the queries used, so you may need to apply the queries below for these layers. Right click on the layername >> Properties >> Source >> Provider Feature Filter.

For TNMDerivedNames Layer - apply the query below

GAZ_NAME IS NOT NULL AND ((GAZ_NAME) NOT LIKE '%HISTORICAL%')

For Structures layer - apply the query below

((FCODE = 73002 OR FCODE = 73003 OR FCODE = 73004 OR FCODE = 73005 OR FCODE = 73006) AND SOURCE_ORIGINATOR LIKE '%Oak Ridge%') OR FCODE = 74026 OR FCODE = 80012 OR FCODE = 78000 OR FCODE=83006 OR FCODE = 78006 OR FCODE = 82010 OR ( FCODE = 74034 AND NAME LIKE '%Police%') OR FCODE = 74036

For Structure_GNIS layer - apply the query below

((GAZ_FEATURECLASS = 'Cemetery' AND (GAZ_NAME) NOT LIKE 'INDIAN%' AND (GAZ_NAME) NOT LIKE '%INDIAN%') OR GAZ_FEATURECLASS = 'Post Office') AND GAZ_NAME IS NOT NULL AND (GAZ_NAME) NOT LIKE '%HISTORICAL%'

That’s all I’ve got for this post. If you do end up downloading and using the style files, please let me know if how it works out for you. Thanks for reading as always :)