DEM and Contour Visualization in QGIS

This short write up is a follow up to the previous tutorial on creating contours from SRTM DEM. Here are some quick tips and tricks for visualizing contours and DEM in QGIS. I am using QGIS v3.22 so if you are using an older version of QGIS the visualization/rendering options may not be available. I am also using the SRTM DEM (e.g. N45W122.hgt) that I downloaded for Mount Hood area from the previous tutorial on creating contours from SRTM DEM.

Tip 1: Contour Rendering

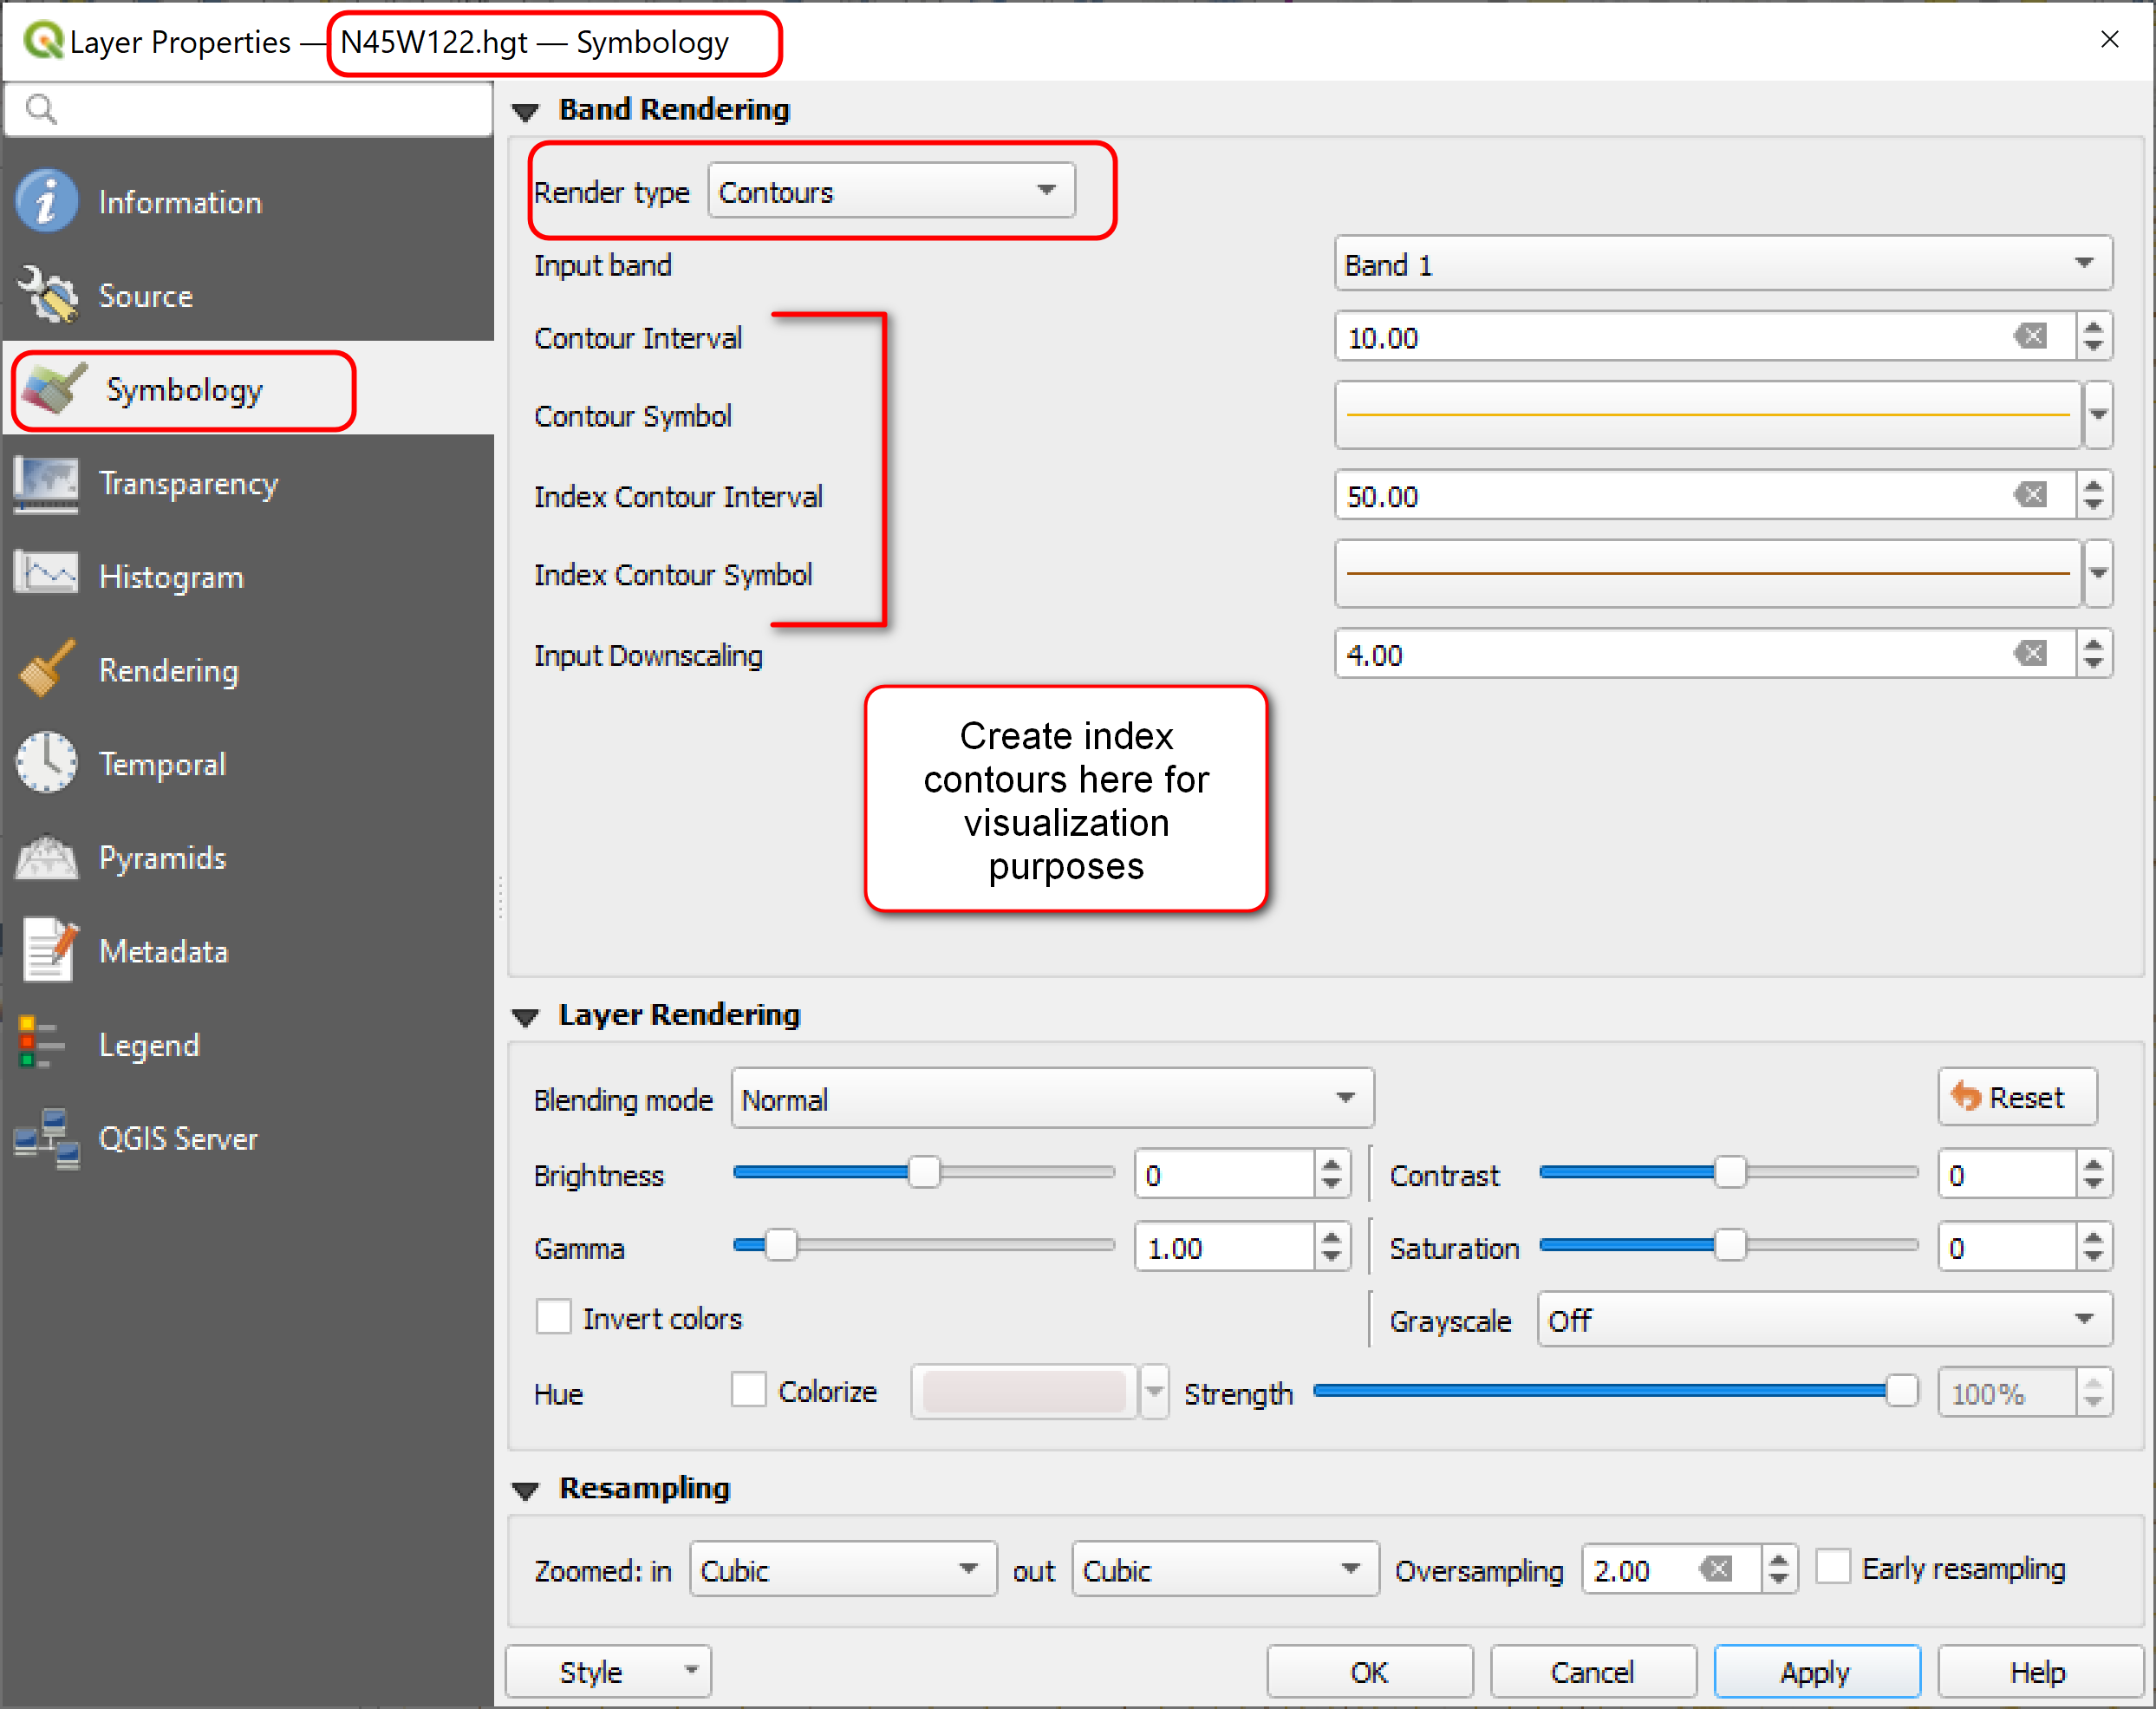
Instead of using the Raster >> Extraction >> Contour tool to generate contours from a DEM, you can just apply the Contour rendering style on the DEM raster. Note though this is only for visualization purposes. Under Symbology, select Render Type = Contours. There are options to create contour intervals and index contours. See an example below with contours displayed at 10 meter intervals with index contours every 50 meters.

Index Contour symbology

Contour rendering options for DEM

Tip 2 : Hillshade Rendering

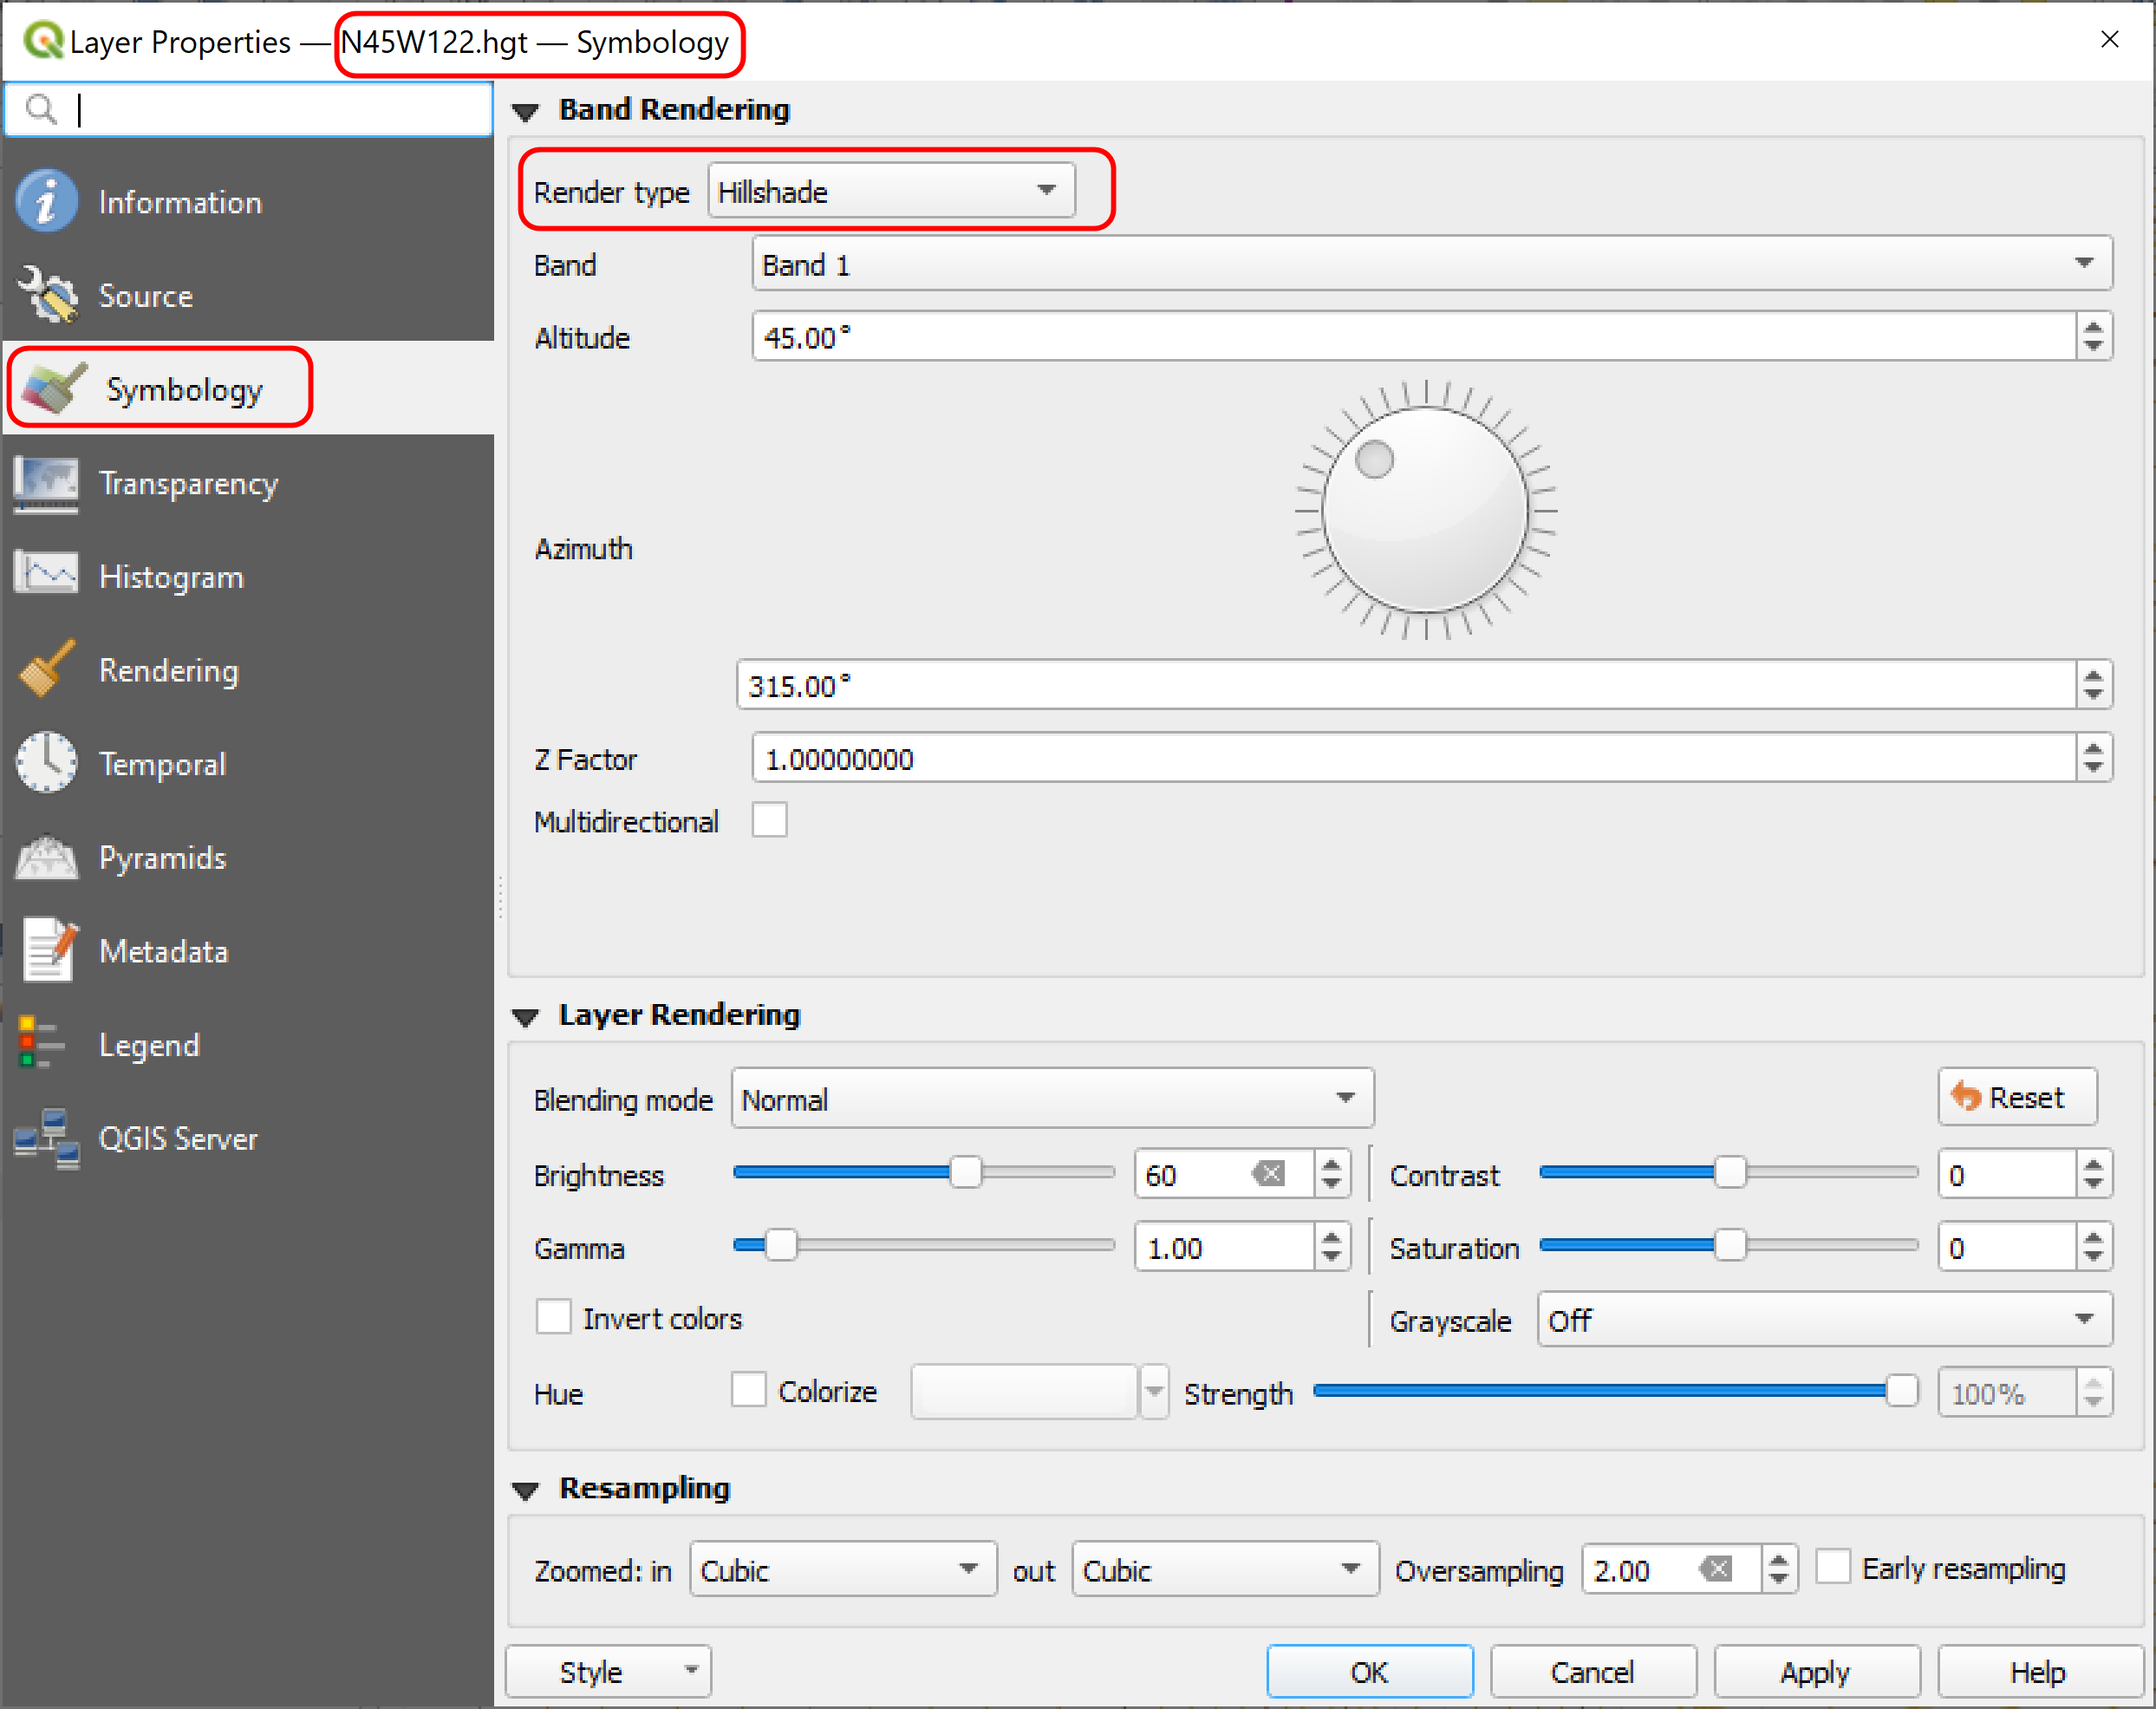
You can also make a copy of the DEM (copy and paste raster in the TOC) and apply a hillshade rendering as well to get a 3D-ish visualization on the DEM. Play around with the different options to see what will give you the best result.

QGIS Hillshade rendering DEM

Hillshade rendering options. Note: Hillshading on my .hgt DEM came out really dark.

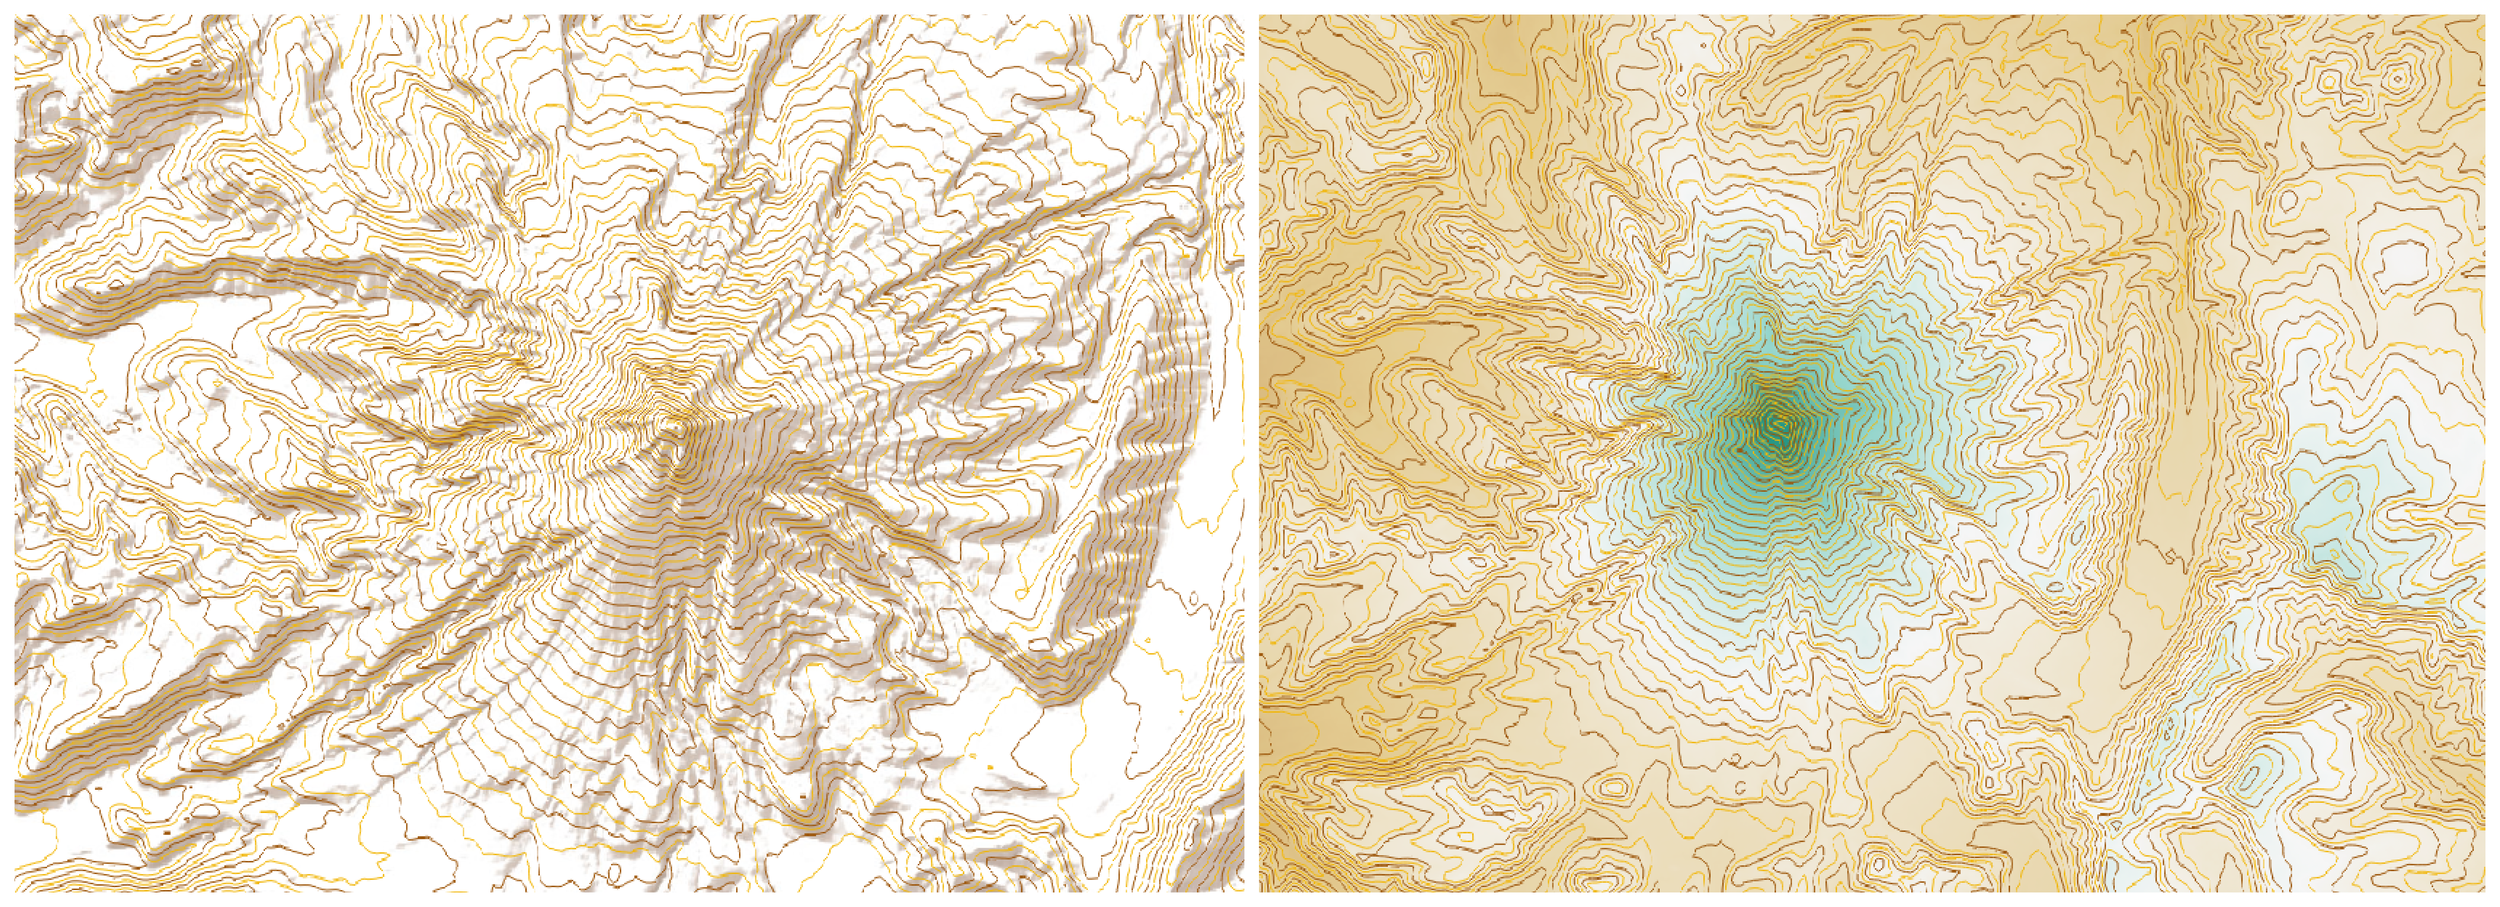
Here is an example of my contours rendering on top of a hillshade and a single pseudocolor option.

Contour Hillshade QGIS

Left: Contour (index = darker line) on top of ESRI terrain imgaery; Right: Contour (index = darker lines) on top of SRTM DEM (N45W122.hgt) singleband pseudocolor

Tip 3: 3D Map View

Create a 3D map view along with a 2D view of the contours. Go to View menu >> New 3D Map View. You may get a warning popup that 3D Map View doesn’t support unprojected coordinate systems - in this case, just change your project’s coordinate system (e.g. WGS84 UTM Zone 10 meters) then open the 3D map view again.

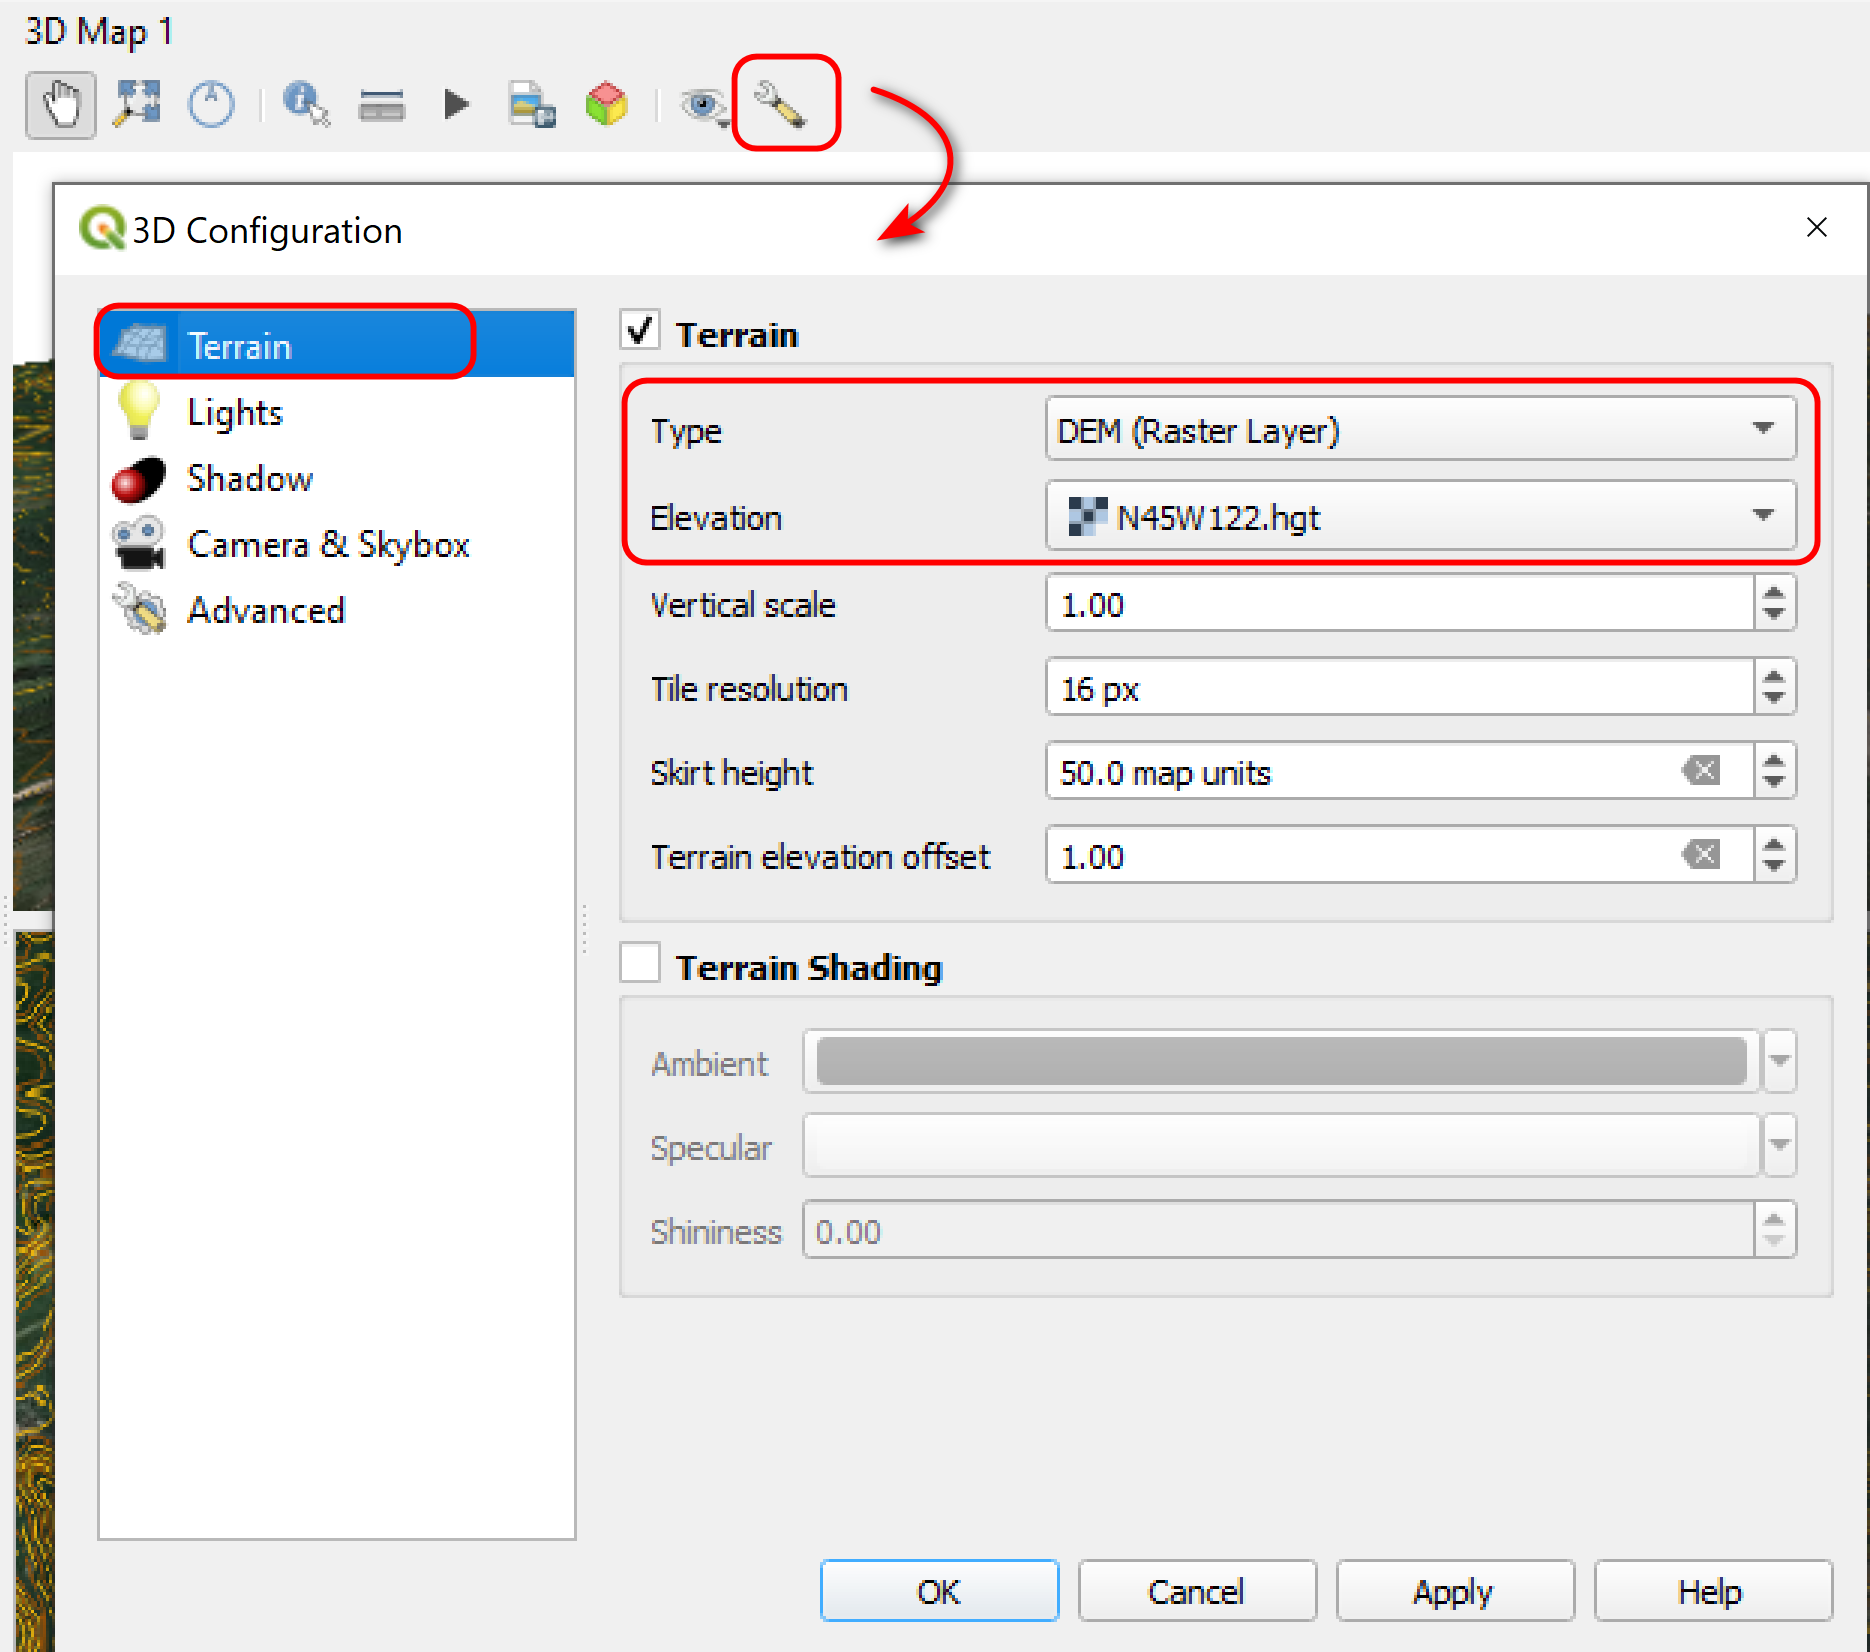
In the 3D Map window, make sure you change the Terrain configuration to use the DEM raster (the default is a flat flat terrain view). See example below: Type = DEM (raster layer) and Elevation = DEM file (e.g. N45W122.hgt).

QGIS 3D Map View Configuration

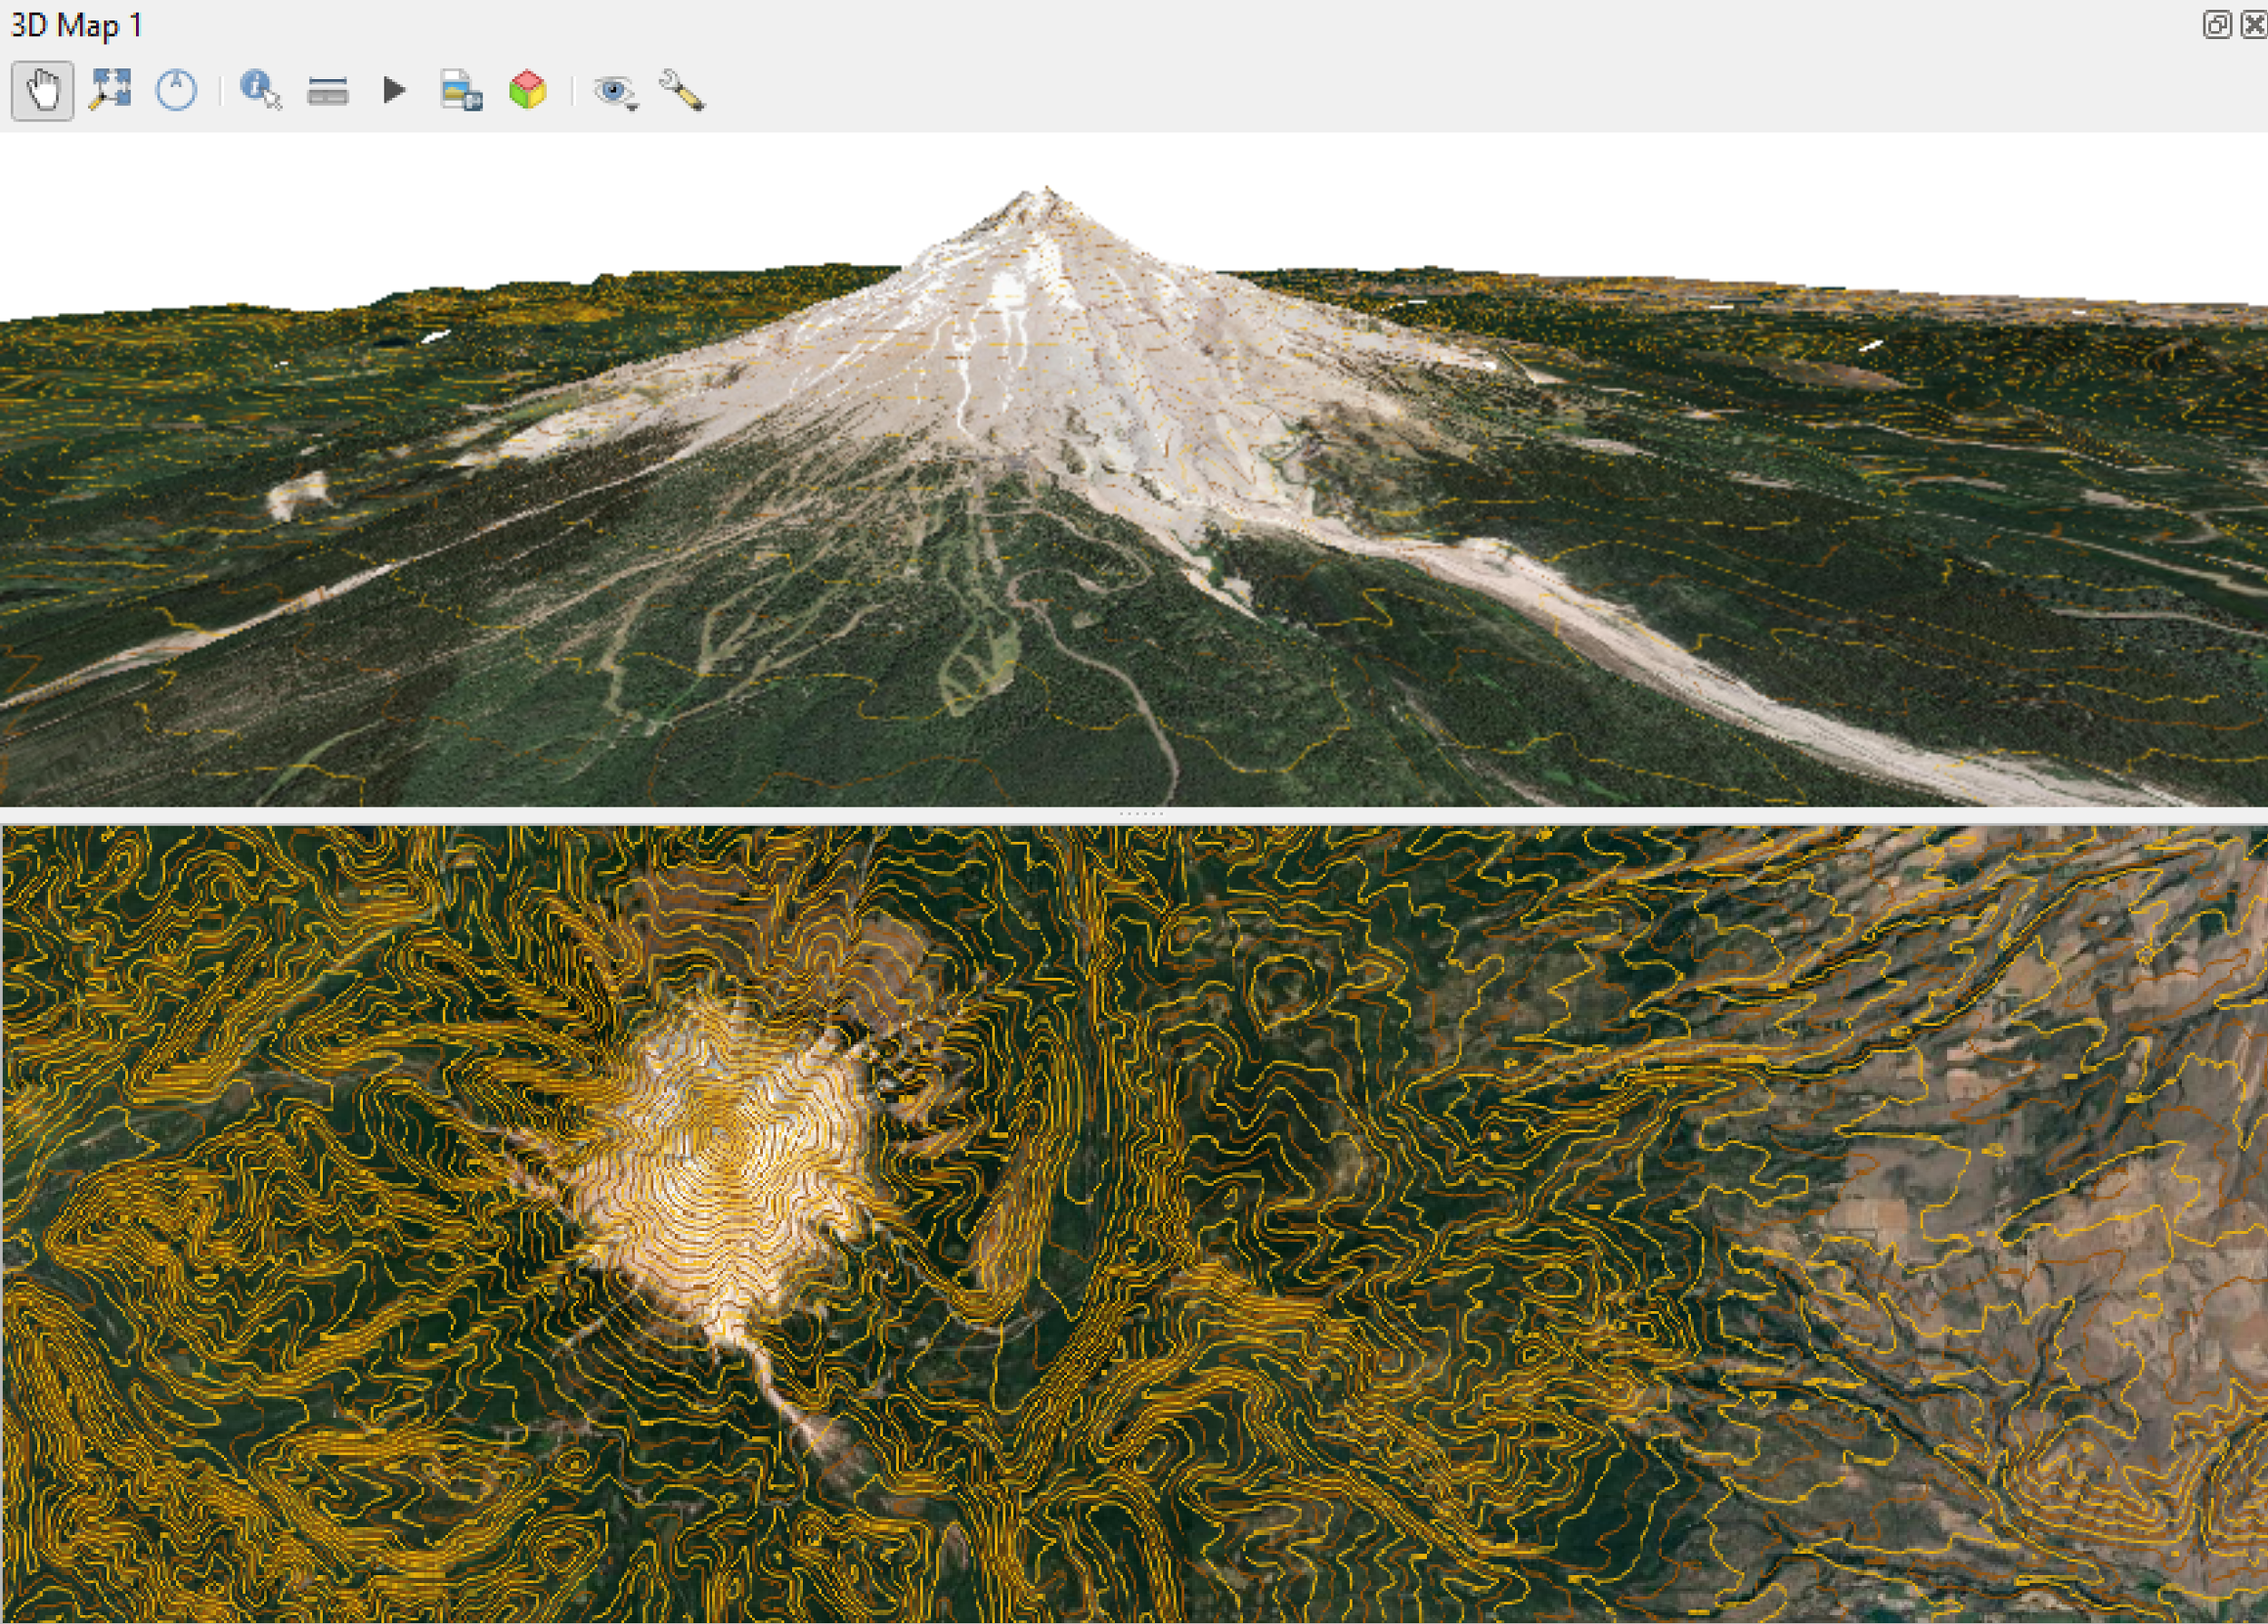
Here is an example, showing the contour rendering on top of Google aerial image in a 2D map view and a 3D map view

2D 3D map view QGIS

That’s all the tips I have for now. As always thanks for reading.

Creating Contours from DEM using QGIS

I often get asked to create contours from DEM for engineers and architects for site planning purposes. I primarily use ArcGIS Pro at work to generate contours with ESRI provided terrain data or Lidar derived DEM. But for this tutorial I will show you how to generate contours from a publicly available DEM using QGIS.

For this tutorial, I am using a 30-meter (1-arc-second) SRTM DEM. There are various ways you can download this data. Below are some options with some tips on downloading and using the SRTM data. This tutorial provides detailed instructions for option 4 which is using the SRTM downloader plugin directly in QGIS (version 3.22).

Notes on SRTM data

If you are not familiar with SRTM data, here are some quick notes on to keep in mind.

  • There are 3 versions of SRTM data. Version 1 is the semi raw data (which you do not want), version 2.1 is non-void filled, and version 3 (SRTM Plus) is void-filled. Version 3 is the version used here

  • SRTM comes in either 1-arc second (30 meters) or 3-arc seconds (90 meters) and are divided into 1°×1° data tiles.

  • Data downloads are distributed as a zipped file in *.hgt format. The filename of the *.hgt file is labeled with the coordinate of the southwest (bottom left corner) cell. For example, the file N45W122.hgt contains data from 45°N to 46°N and from 122°E to 123°E inclusive.

  • *IMPORTANT: the name of the *.hgt file actually contains the source of the file’s georeferencing or coordinate system – DO NOT rename the file, otherwise it will not display properly

  • QGIS with GDAL support can natively read the hgt files (as long as the file hasn’t been renamed)

For more information on SRTM , check out the resources linked below:

SRTM Download Options

NOTES: Some sources require an account to download data. These accounts are free but you need to register first before you can download data.

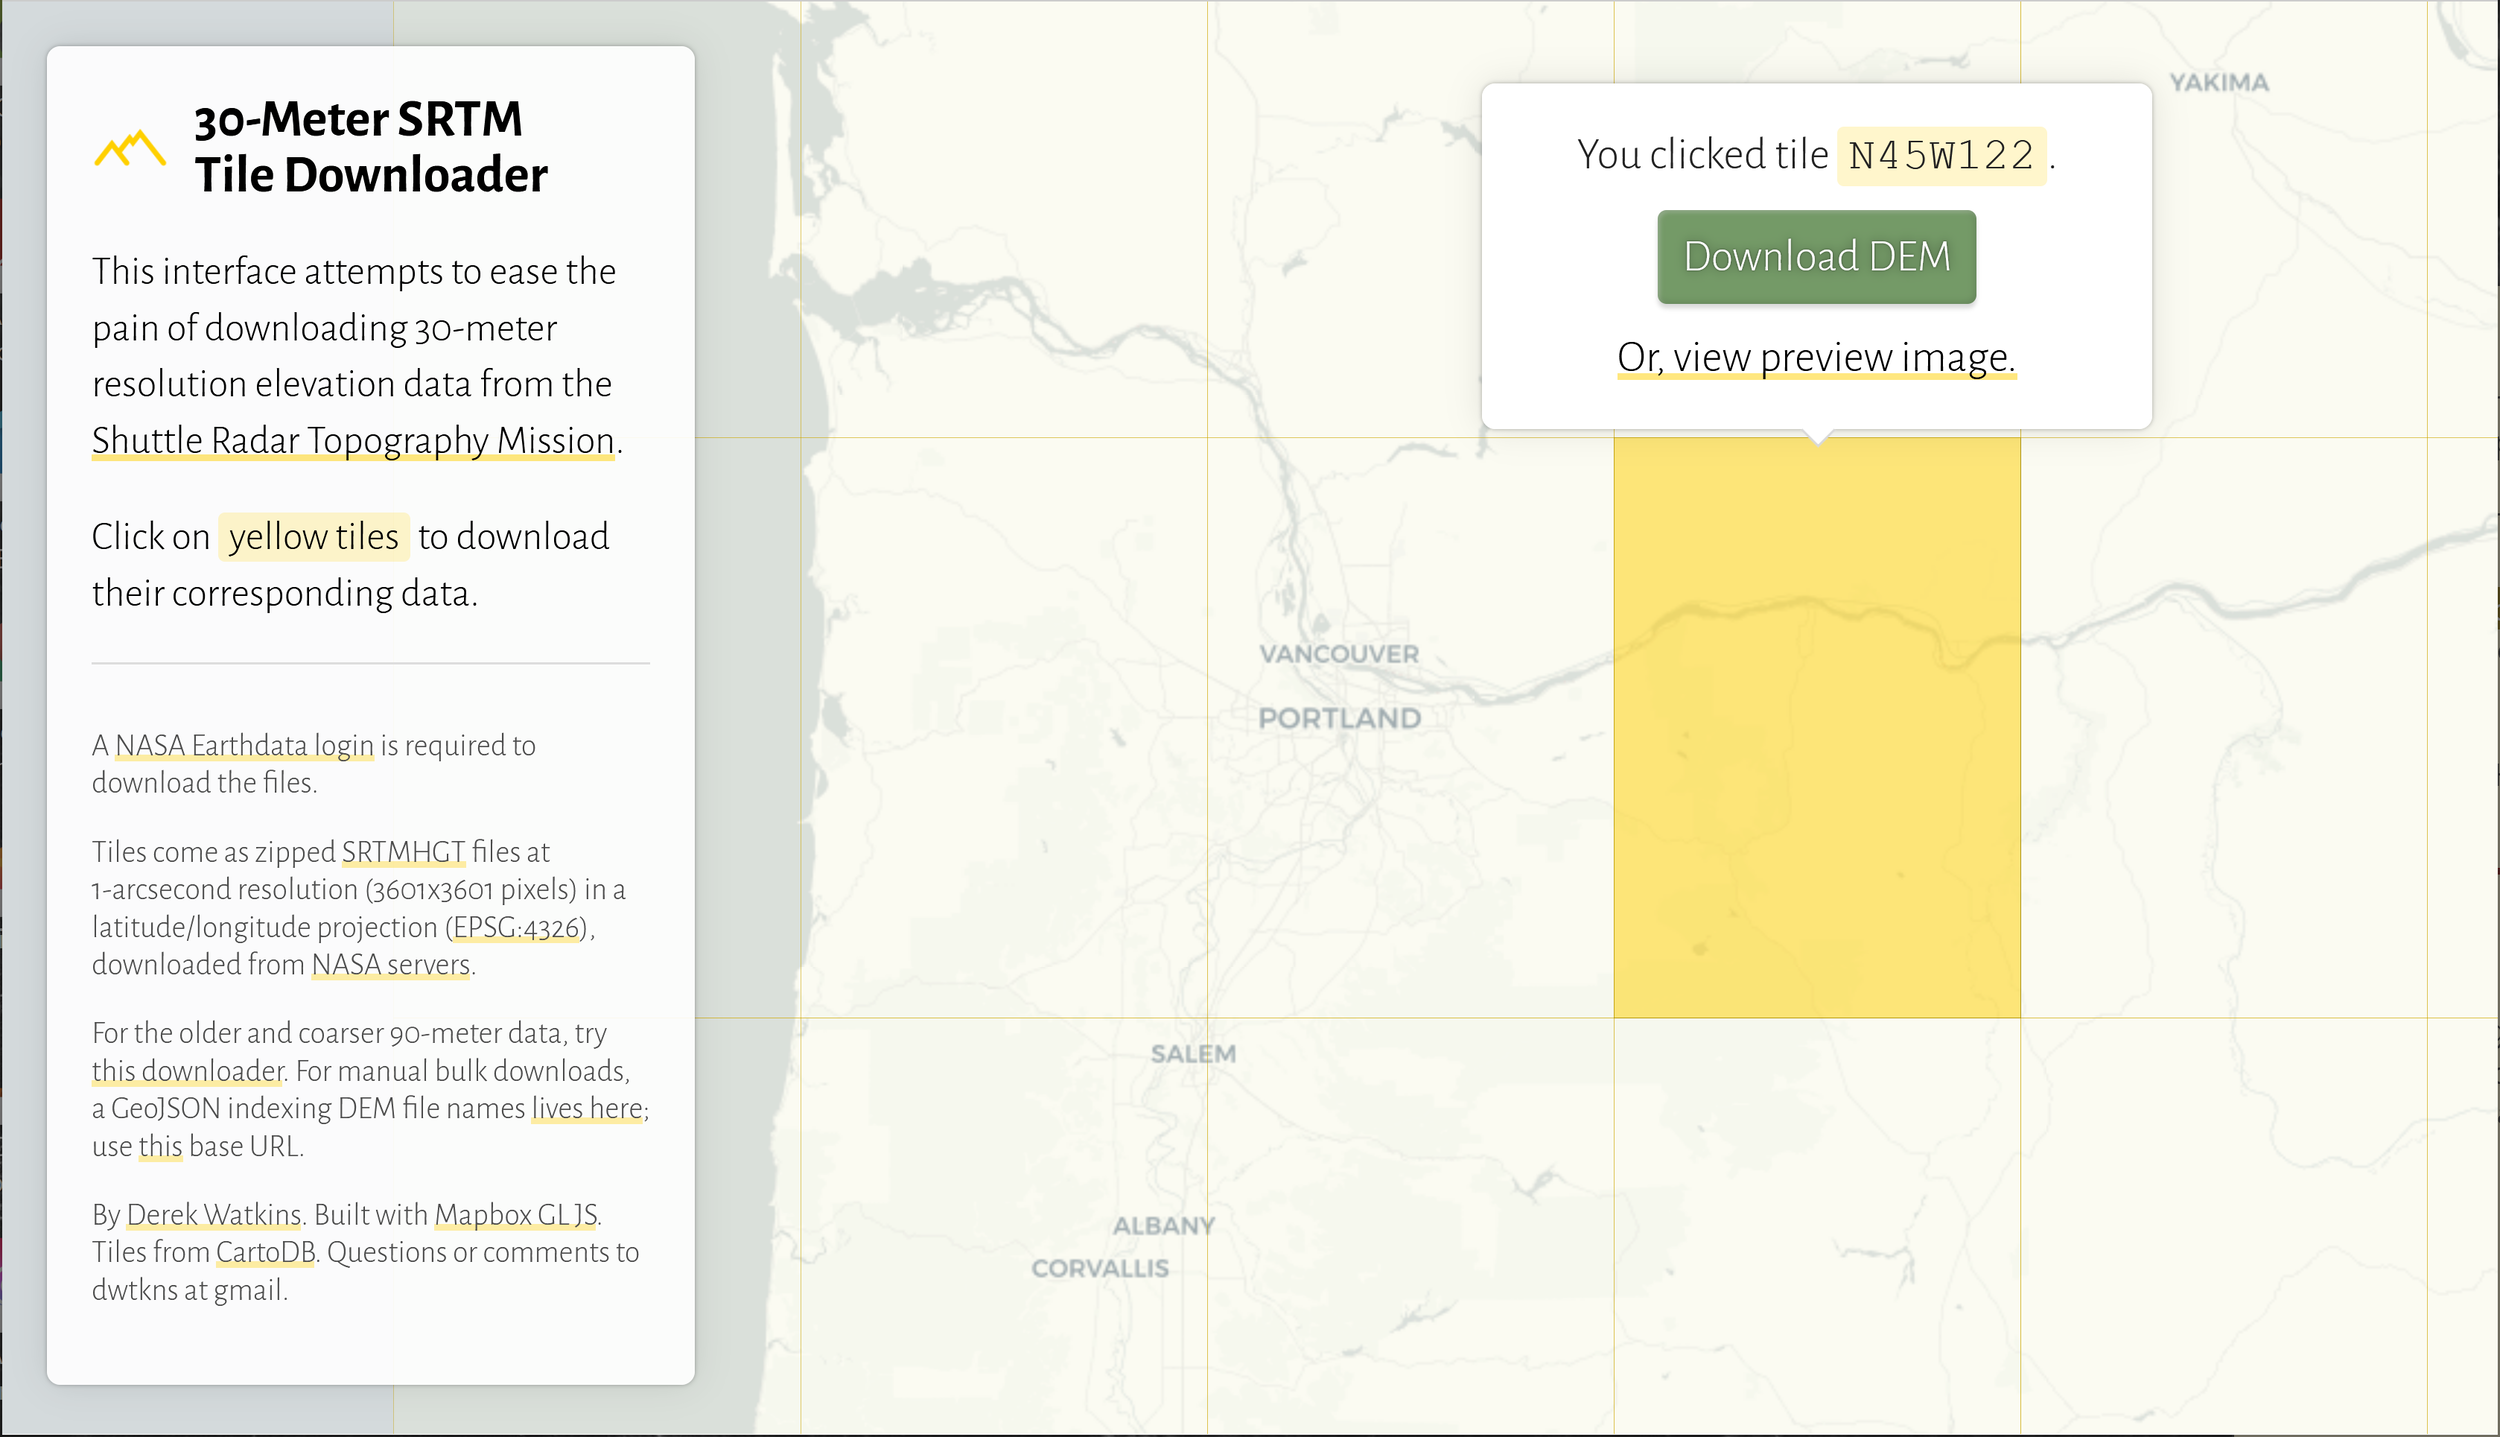
Option 1: SRTM Tile Downloader

This is a nice and simple web app that allows you to quickly download SRTM tiles (1°×1° tiles). I wished it had an option to change basemap for viewing purposes.

SRTM Tile Downloader

To download the data tile, click the Download button and login with your Earth Data account

Tip on extracting the zipped file: When extracting the downloaded file (e.g. N45W122.SRTMGL1.hgt.zip) make sure the extracted folder does not contain the .hgt extension, otherwise QGIS will see the folder as N45W122.SRTMGL1.hgt and think it is a data format (which will not display) instead of N45W122.SRTMGL1.

Extracting *.hgt file

When extracting, make sure to remove the *.hgt for the folder name

Option 2: OpenTopography Download Site

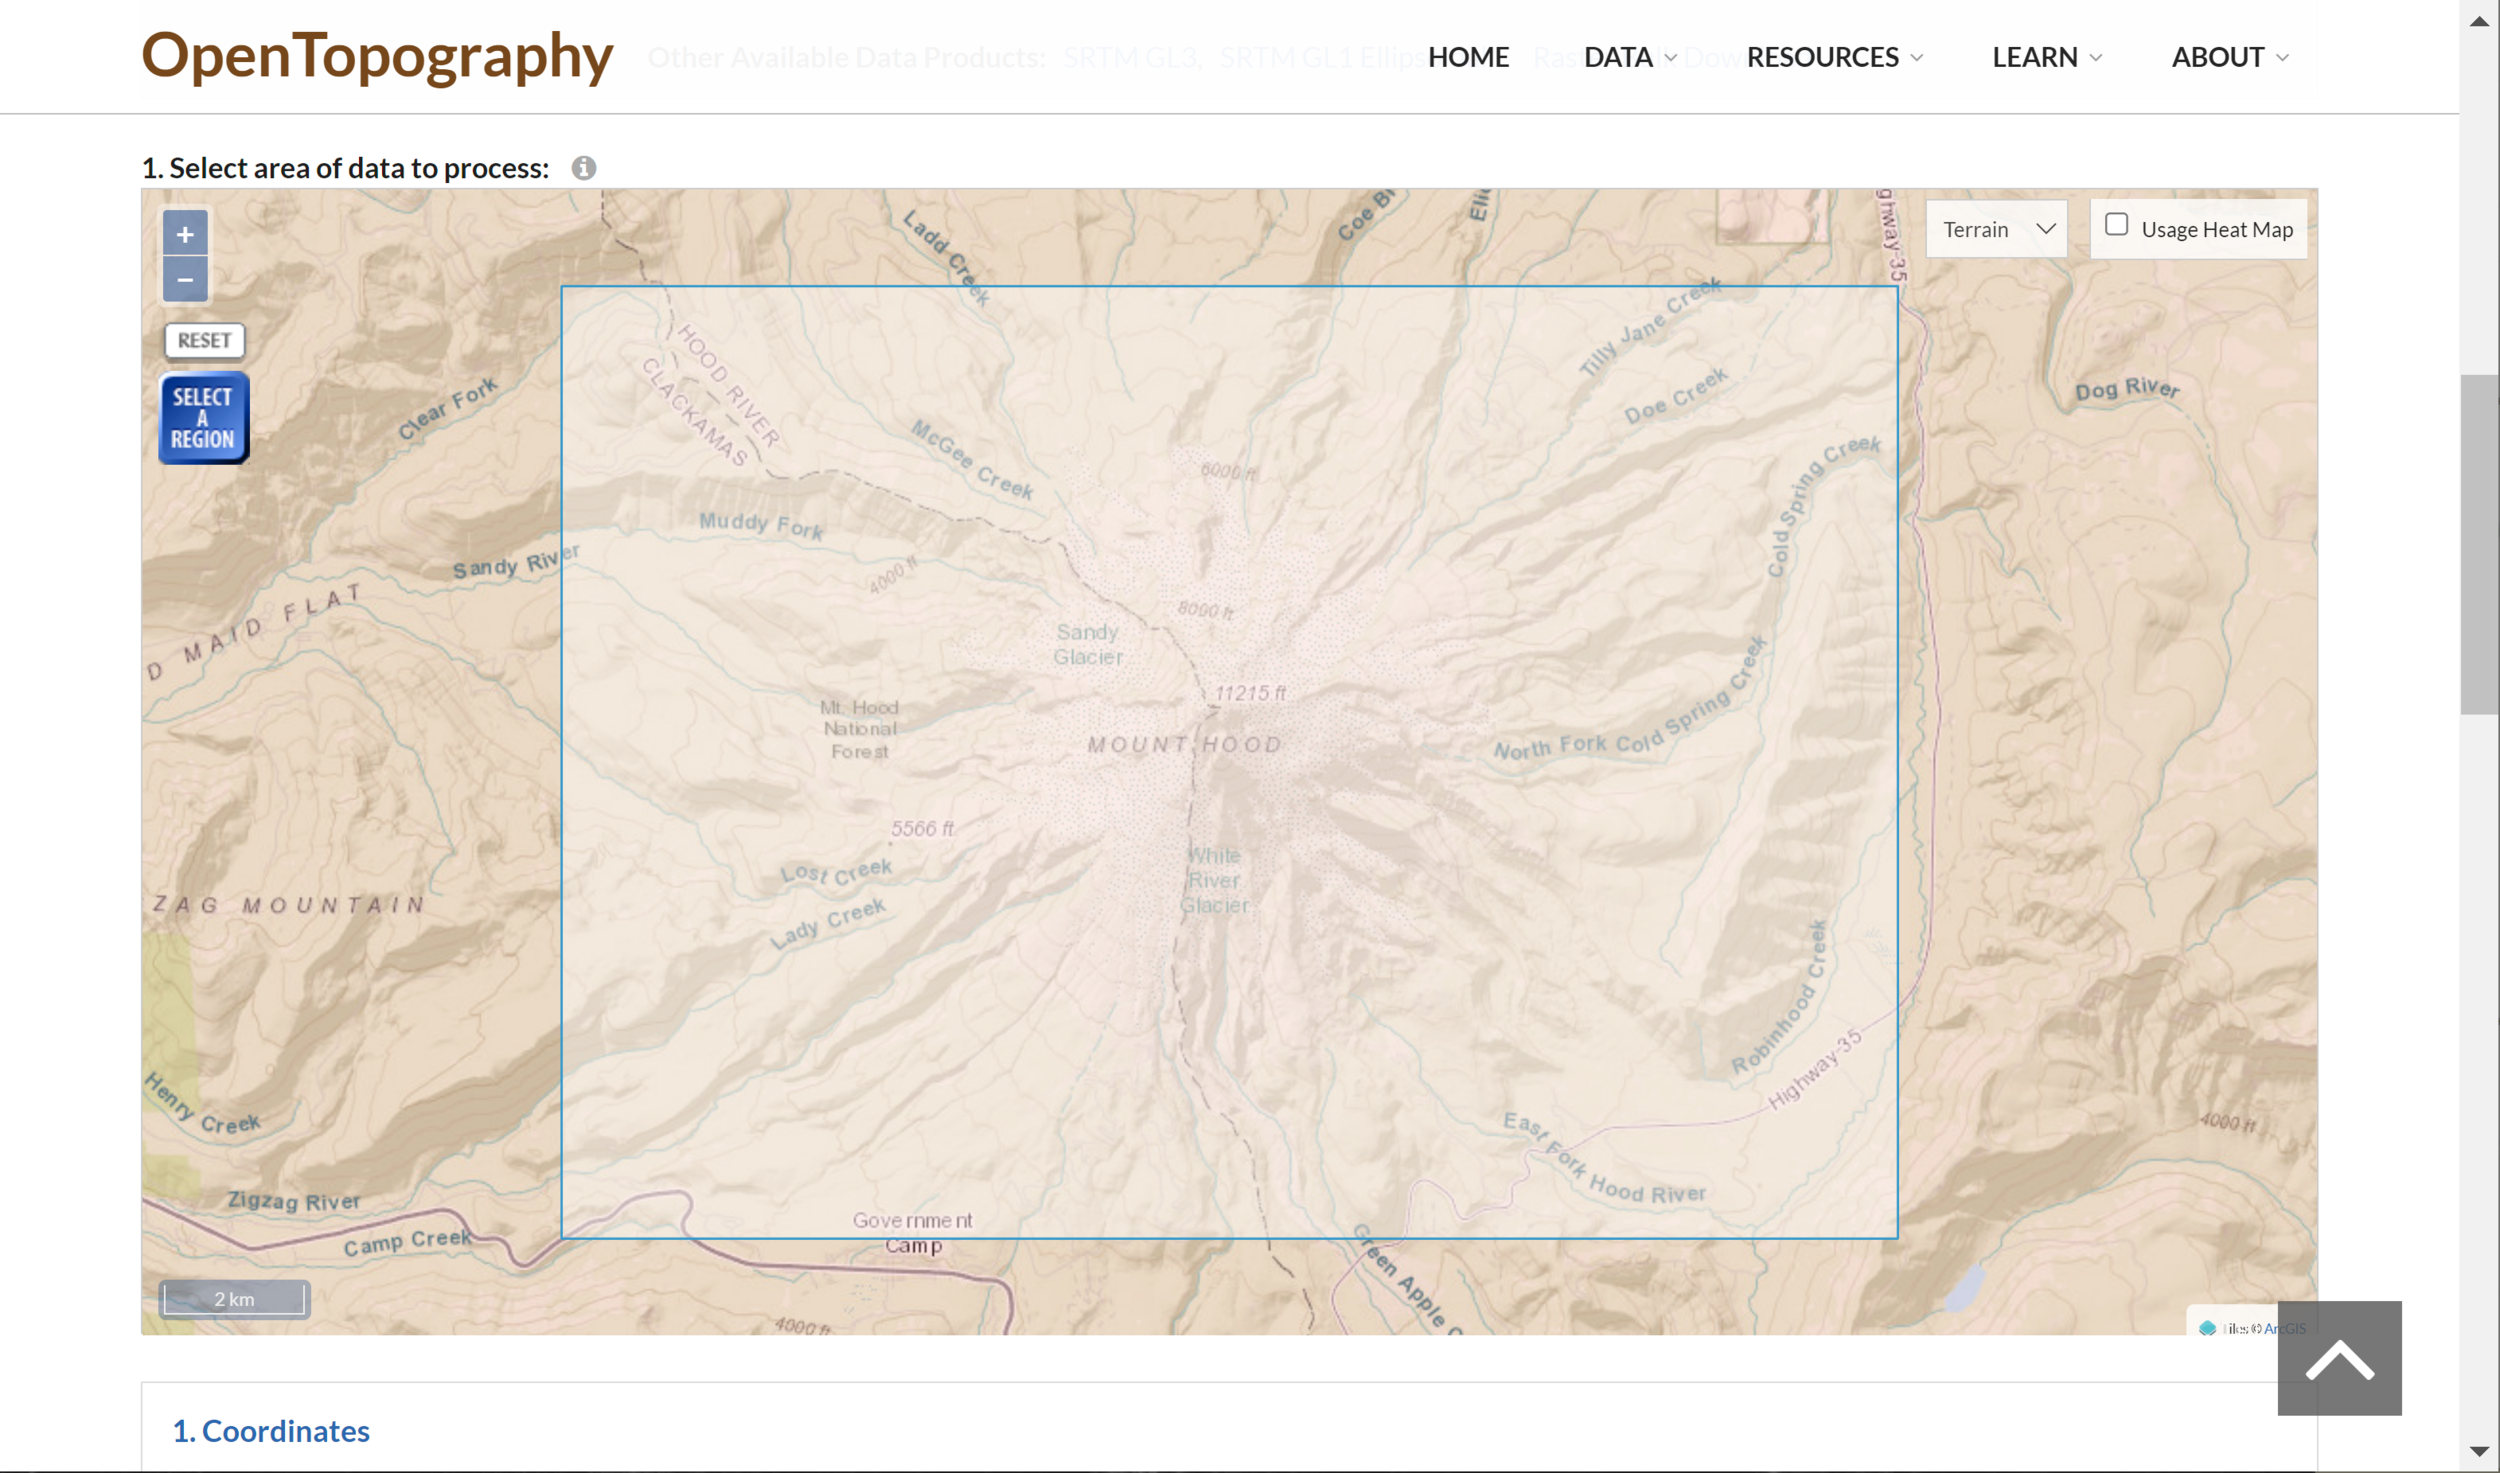
The OpenTopography site does not require an account to download but it does require an email address when submitting download request, so you can describe and keep track of your data download. You can specify a custom AOI extent instead of downloading by tile. This site also has the option to download data as a Geotif, Arc ASCI Grid, or IMG file. However, the data is provided as a tar.gz file, which you will have to unzip first - see the tip below.

OpenTopography Site

OpenTopography site for downloading SRTM data. Instructions for download on the site are self explanatory.

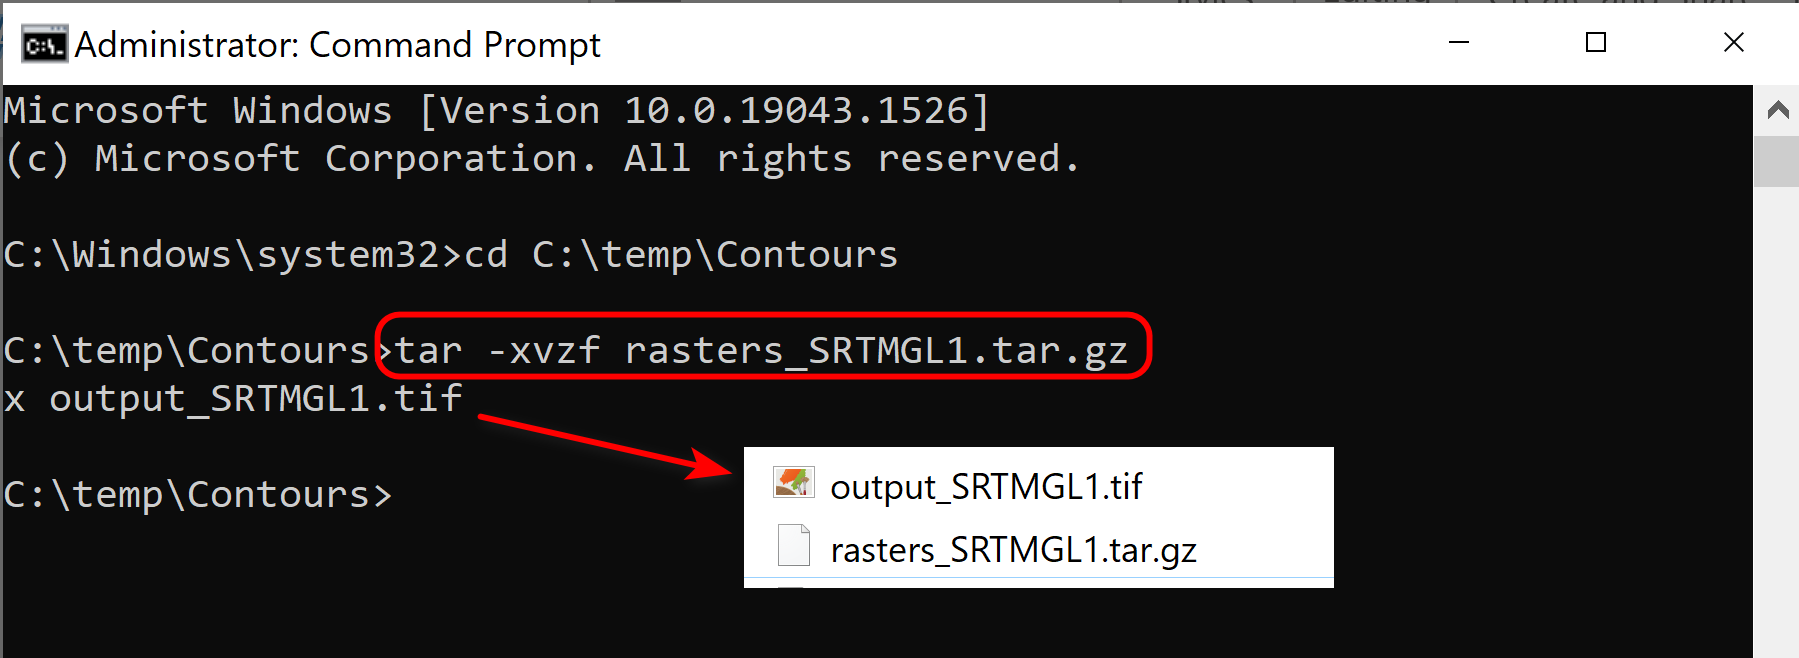
Tip on extracting TAR.GZ on Windows 10 OS:

  • Run Command Prompt as an administrator

  • cd into directory containing the zipped file (eg. cd C:\temp)

  • use the tar -xvzf command on the zipped file (e.g. type in tar -xvzf rasters_SRTMGL1.tar.gz)

Extracting tar.gz windows 10 OS

Example of how to extract TAR.GZ file on Windows 10 OS

Option 3: USGS Earth Explorer

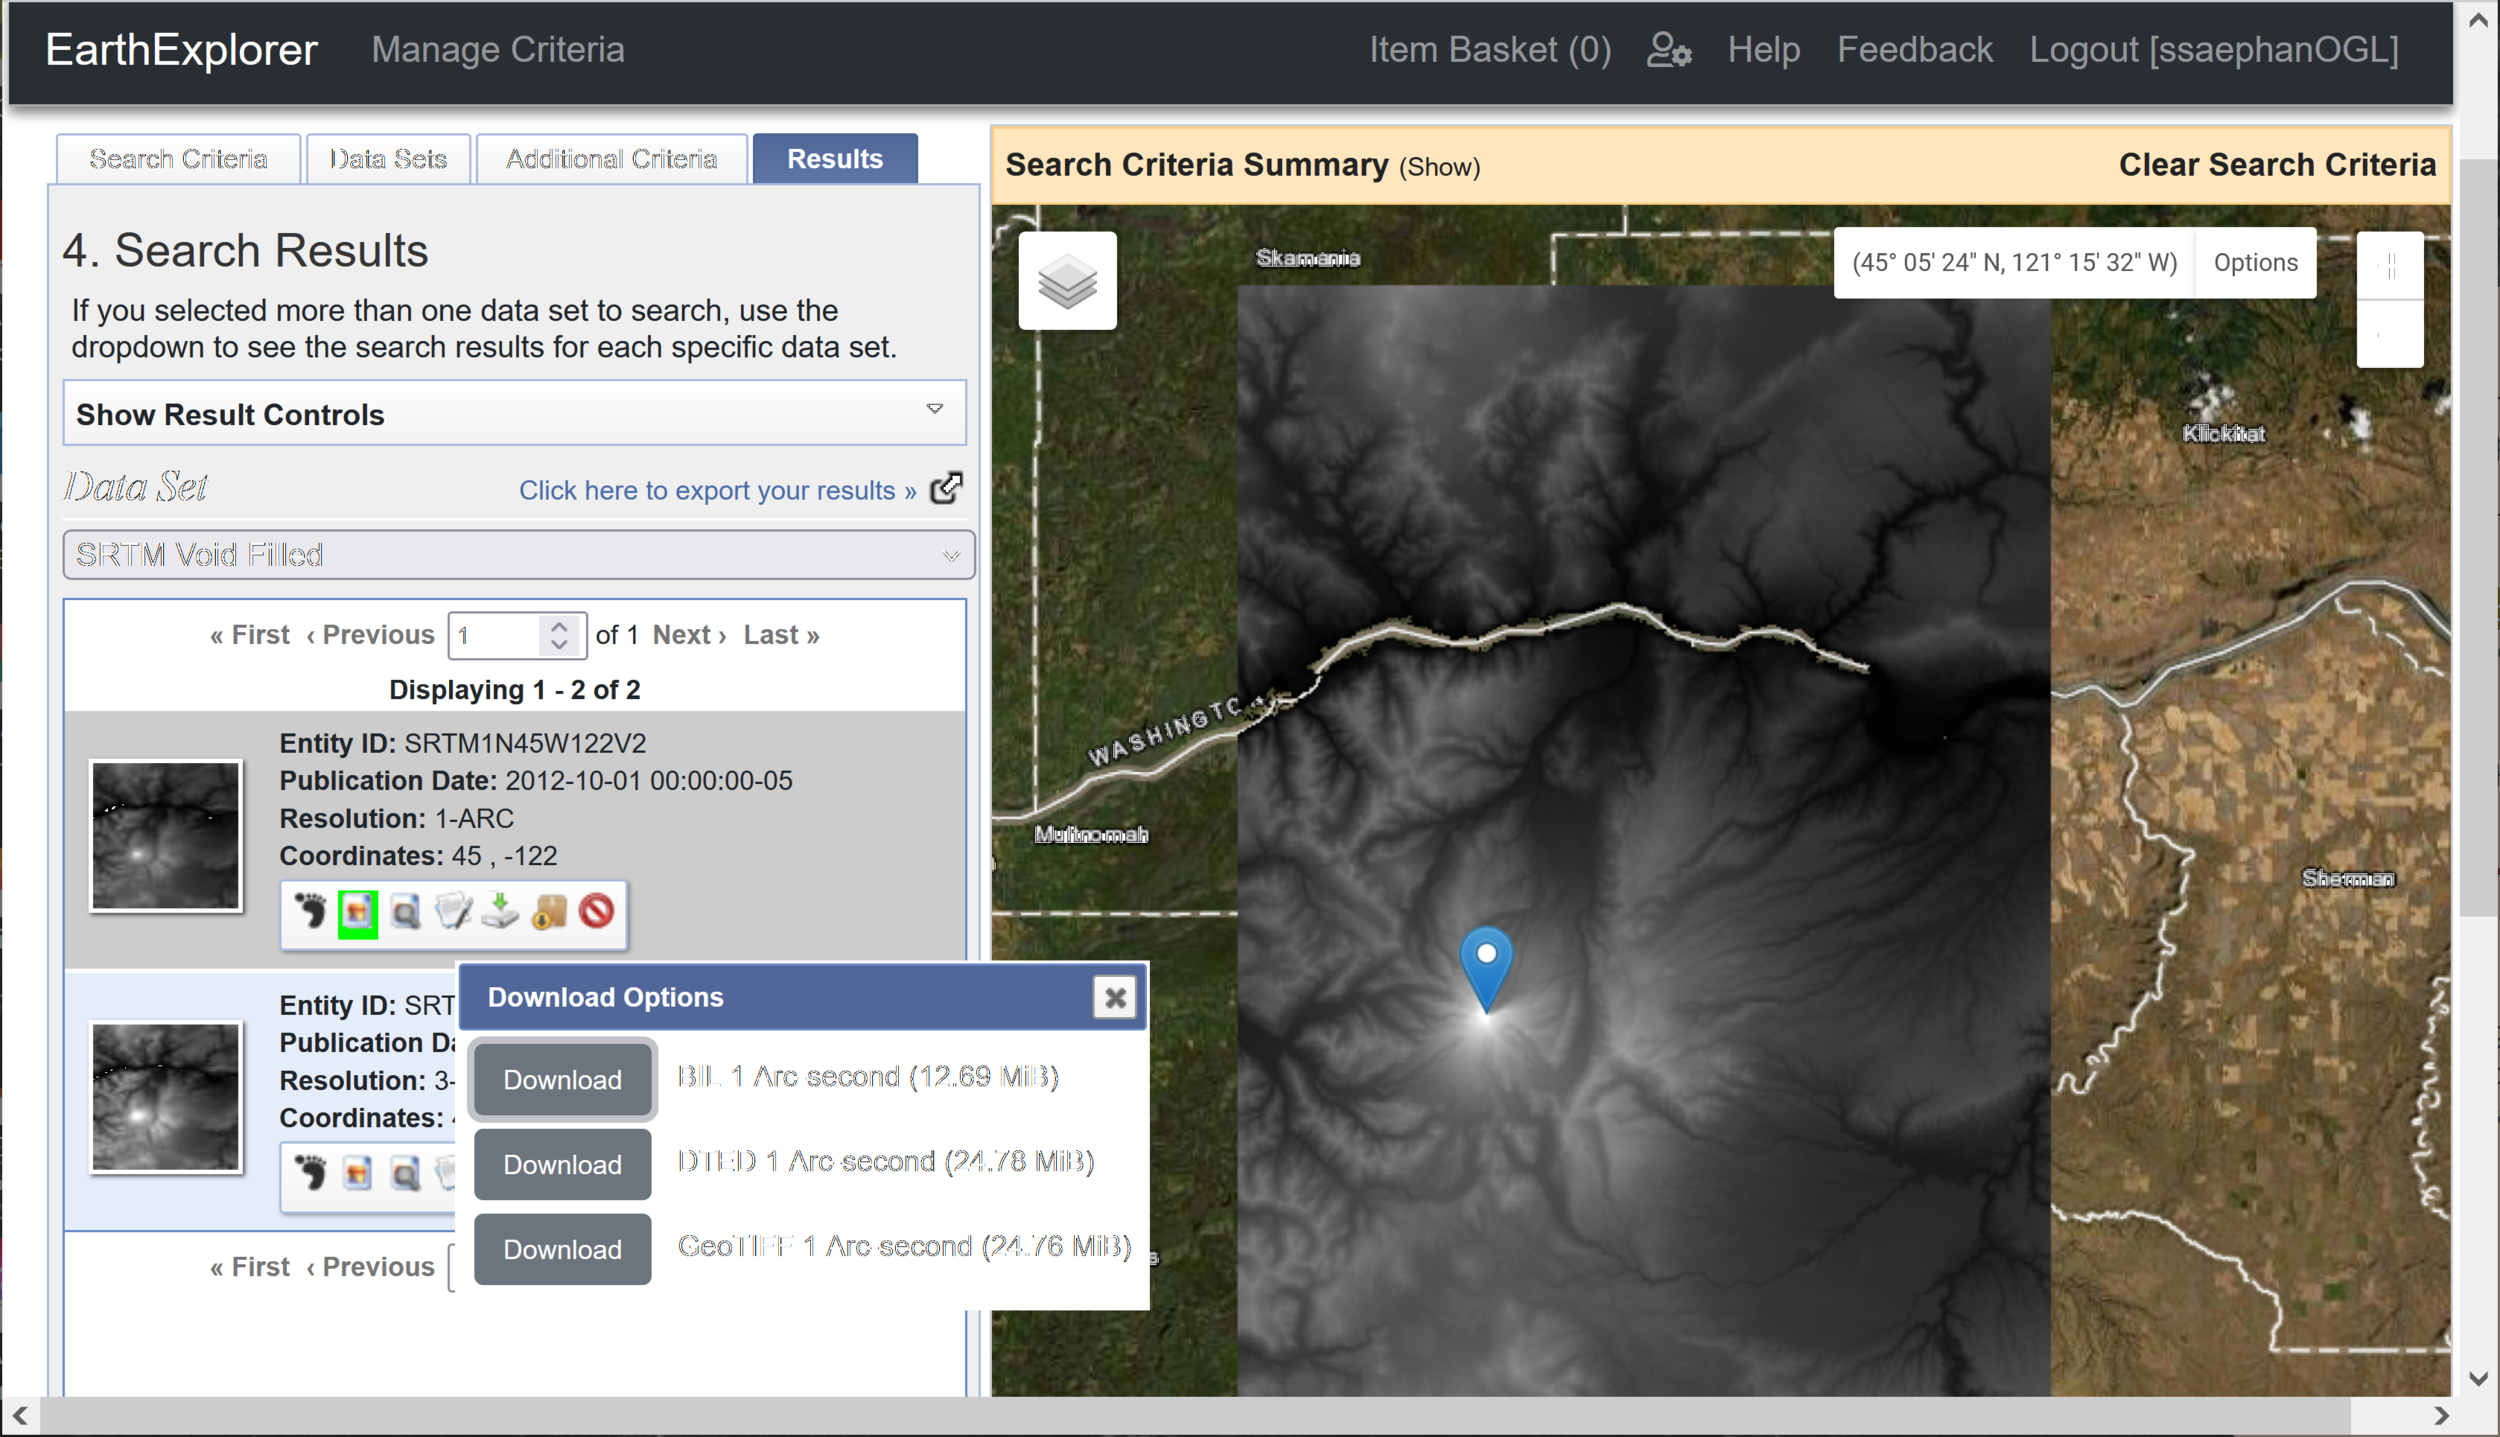
This option requires you to have an Earth Explorer account to download data. It’s not quite as easy to use as some of the other options, but it allows you to download other types of datasets as well as being able to upload a shapefile or KML for your AOI. It also offers download options as Geotif, BIL, DTED formats.

USGS Earth Explorer SRTM download

SRTM data download options in USGS Earth Explorer. Note you will have to need to login with an Earth Explorer account first to download data, otherwise download option is grayed out.

Option 4: SRTM Downloader QGIS Plugin

With this option, you can download SRTM data directly in QGIS. You will need to install the SRTM downloader plugin and also have an Earth Data account. This is the option I will show you here.

Install SRTM-Downloader Plugin

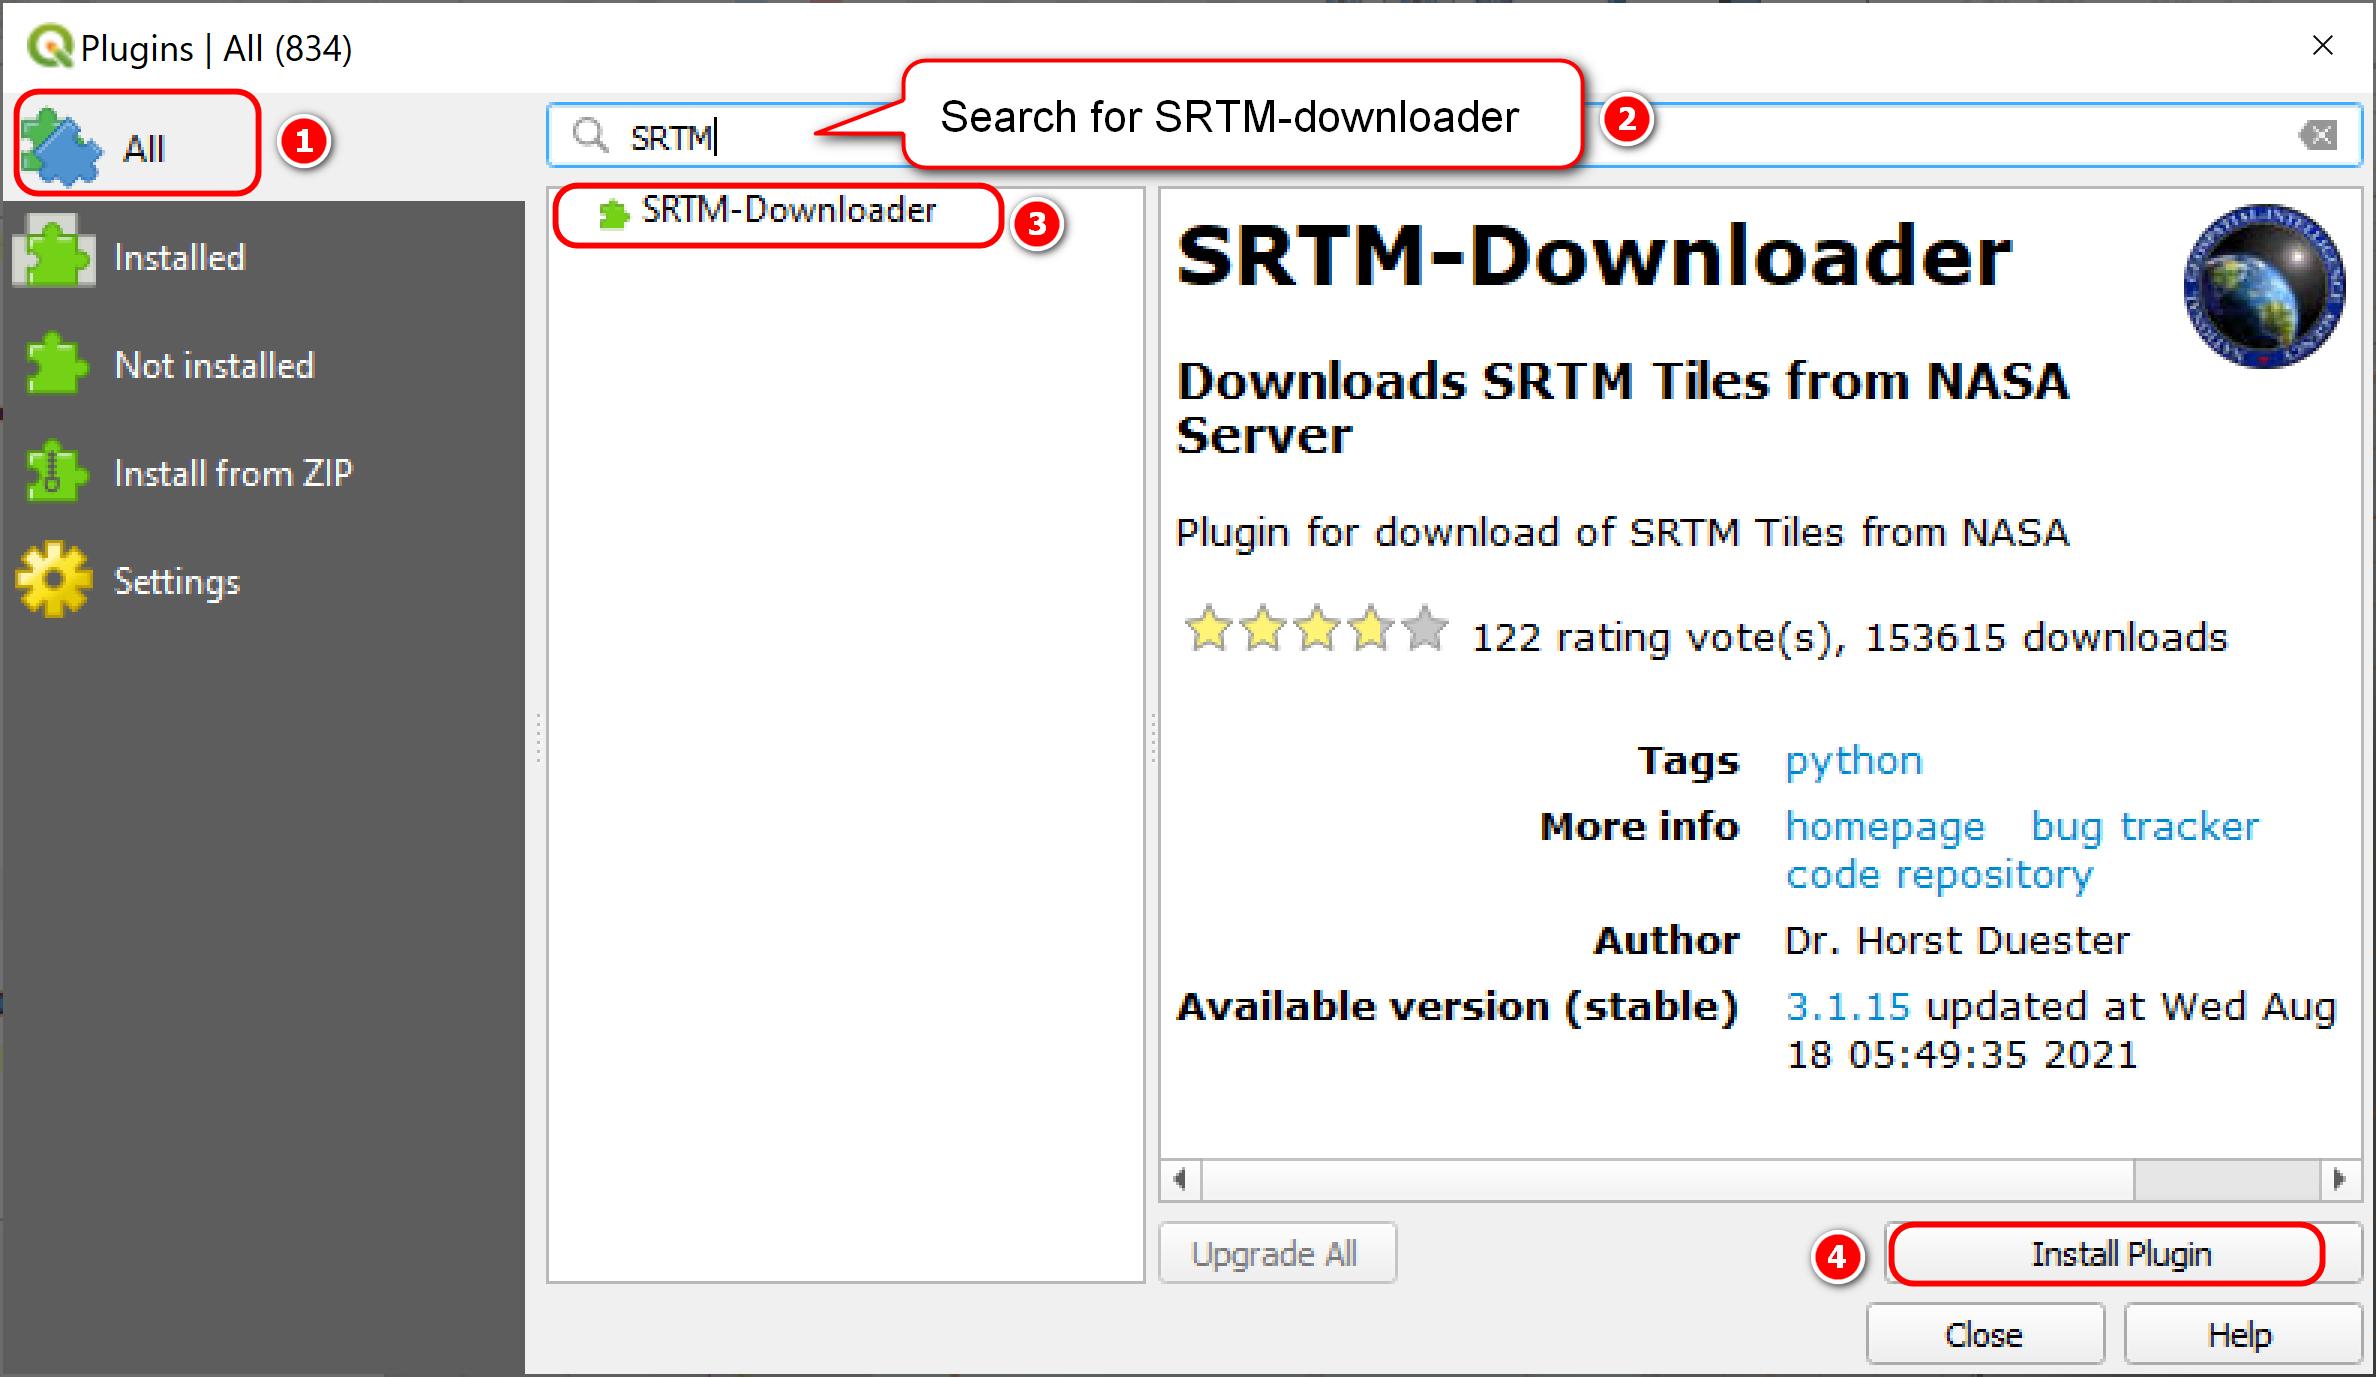
To install the SRTM downloader plugin:

  • In QGIS (I am using version 3.22), go to Plugins menu >> Manage and Install Plugins

  • In the Plugins window:

    • select All >> search for SRTM-Downloader and select it >> Click Install Plugin.

    • you should get a “plugin installed successfully” message. Close the window

SRTM Downloader plugin QGIS

Download SRTM Tile in QGIS

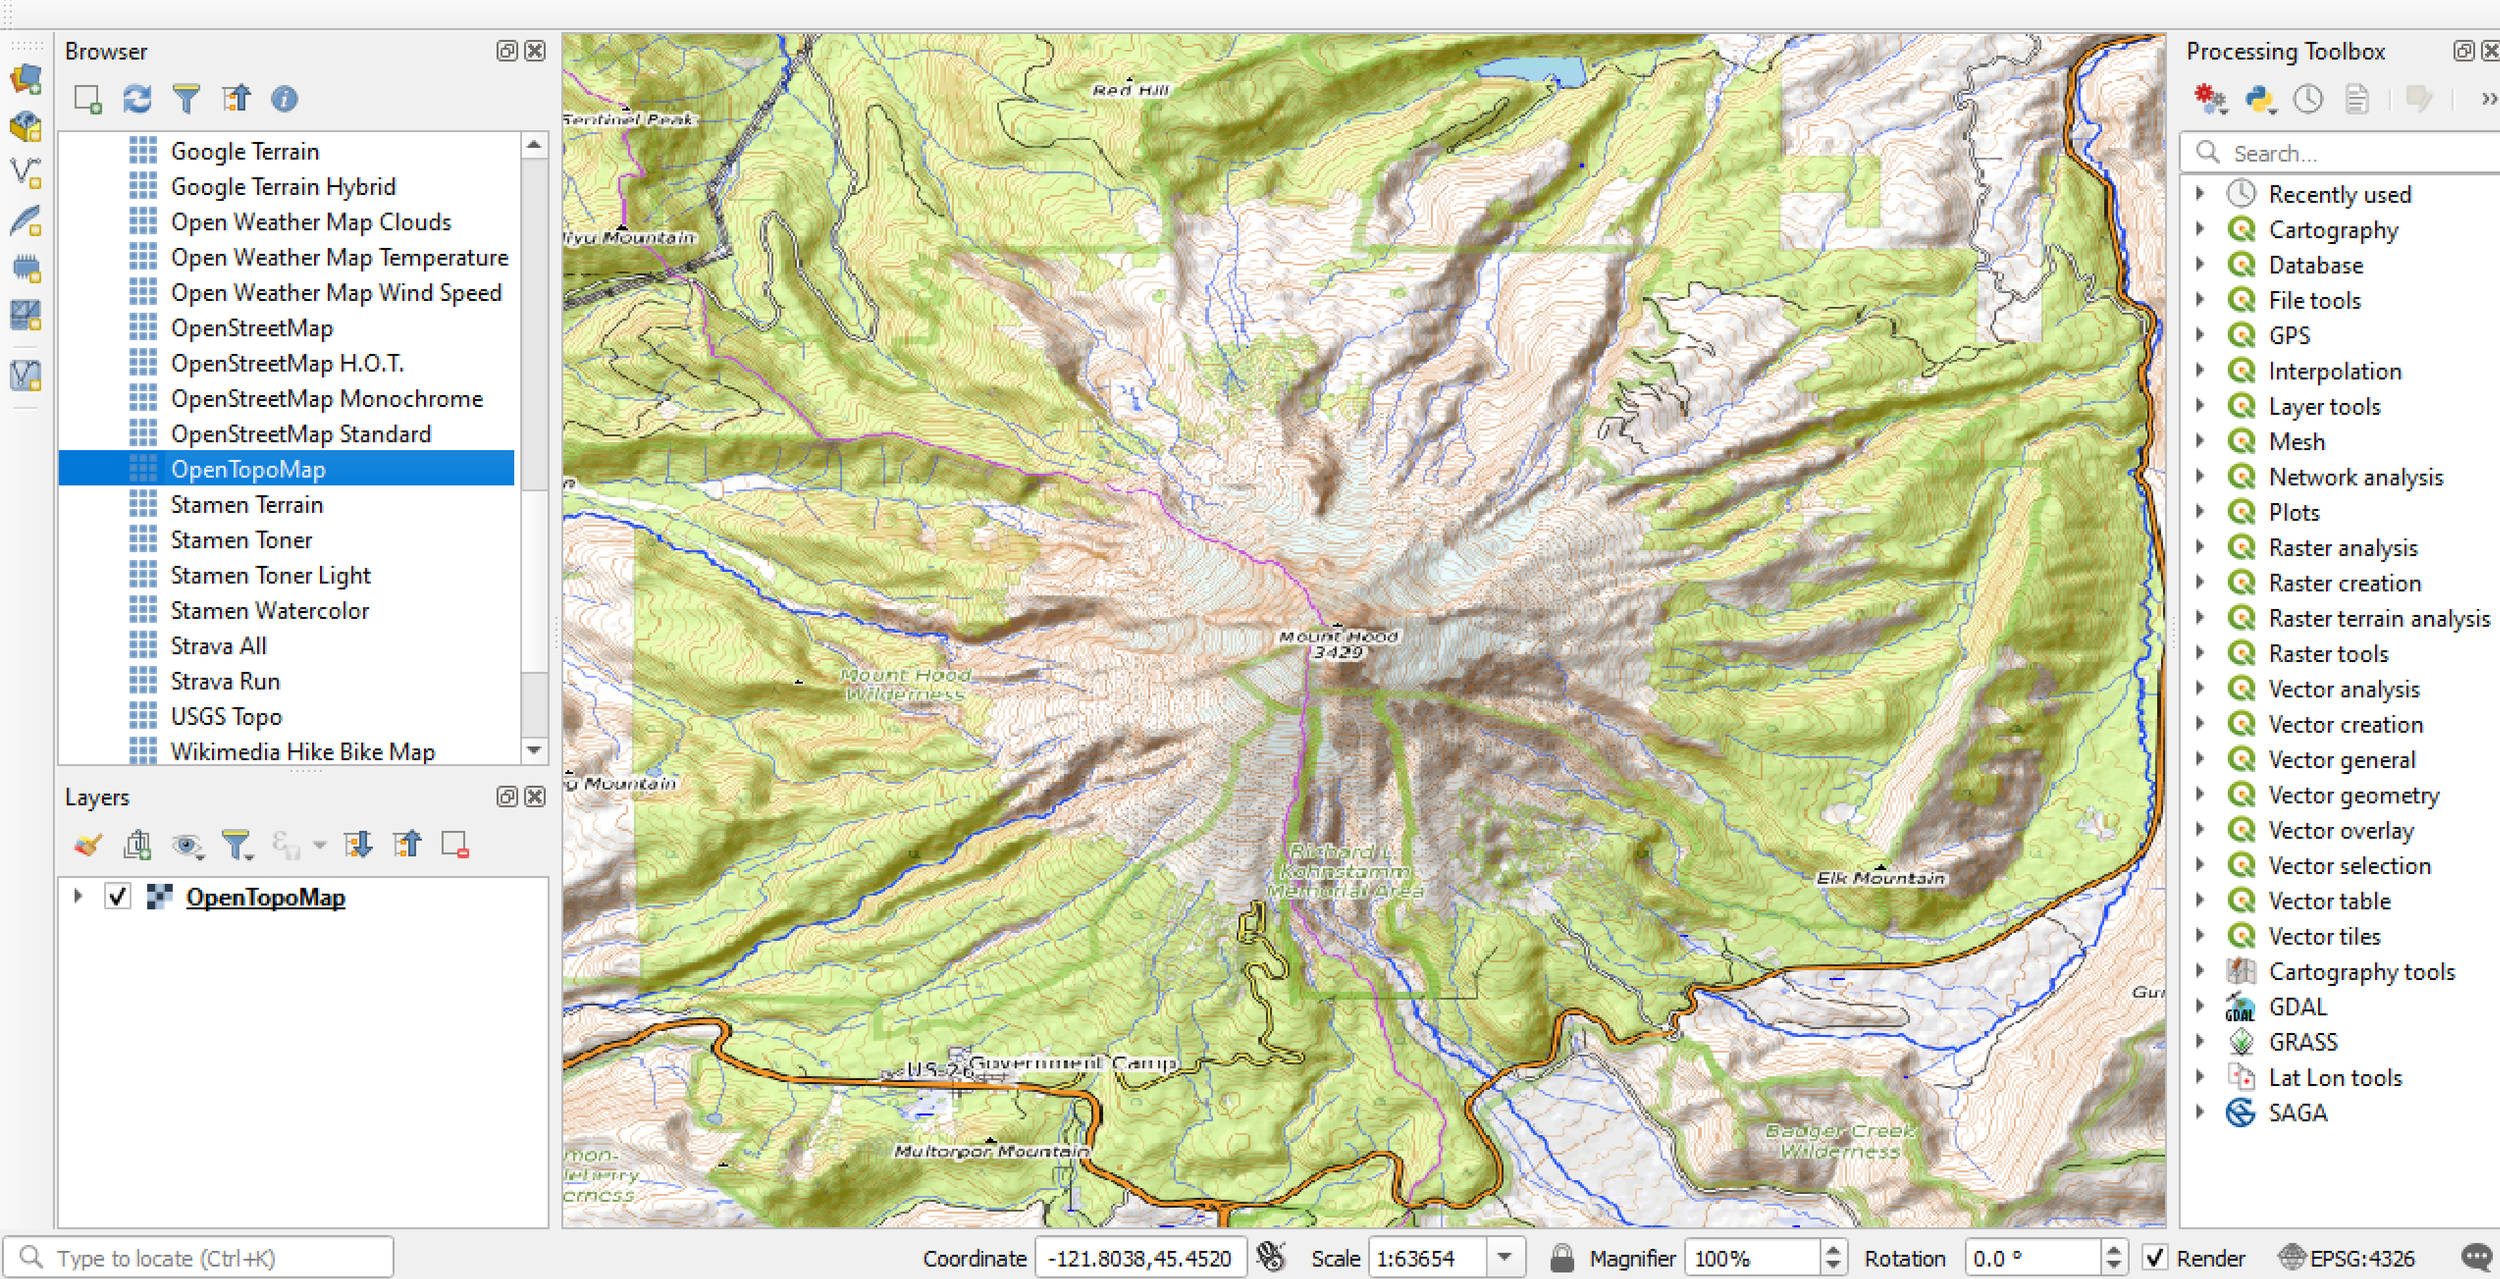
After installing the SRTM-Downloader plugin, you’ll want to add in a basemap and zoom in to your area of interest (AOI). Here, I am using an OpenTopoMap as the basemap. My AOI is Mount Hood, OR.

QGIS SRTM tile

My AOI is Mount Hood, OR.

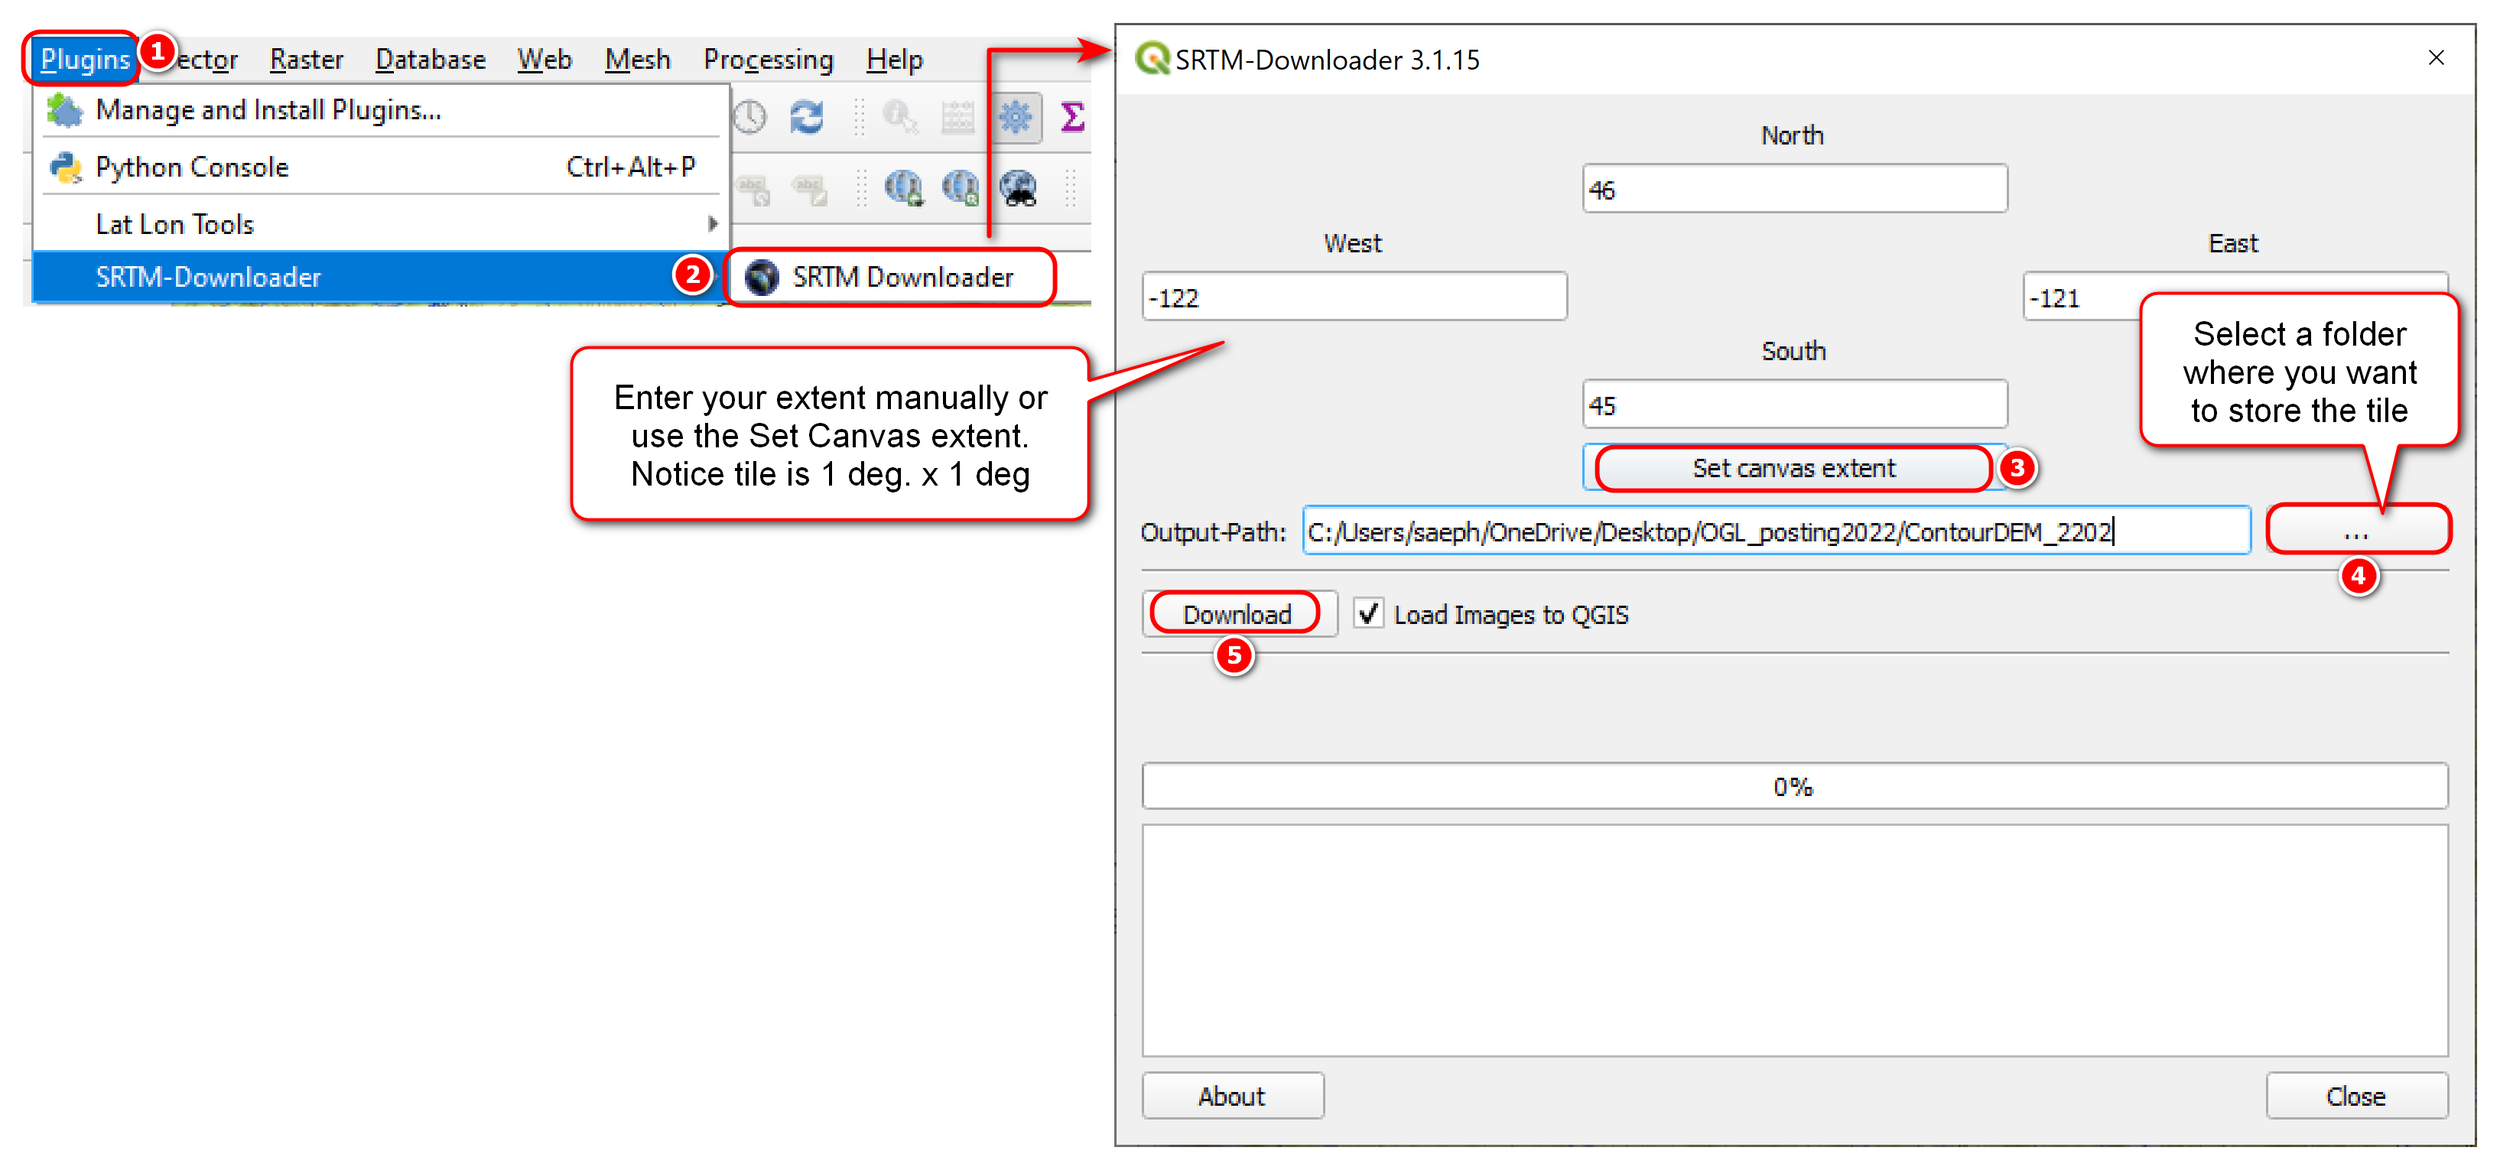
Open the SRTM downloader:

  • Go to Plugins menu >> SRTM-Downloader >> SRTM downloader

  • In the SRTM downloader window: enter your parameters for your AOI and select a folder to download the tile to

  • After you click the Download button, another window should pop up asking you for your Earth Data account login

SRTM Downloader Plugin QGIS

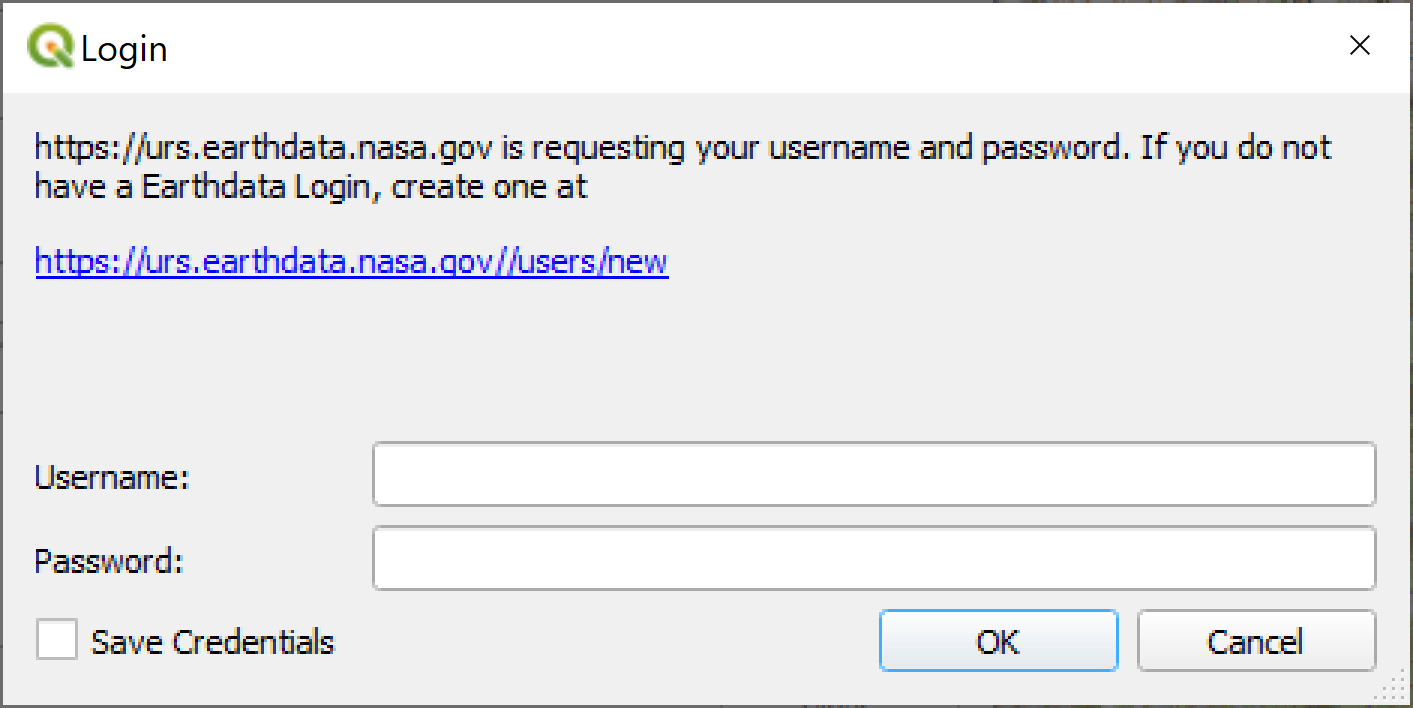
Clicking the Download button will bring up a pop up window asking for your Earth Data account login (see below)

Enter your Earth Data login info. Check the box to save credentials in you want. Click OK and it should download the data.

When it’s done downloading, the DEM should be loaded in QGIS (unless you uncheck that option in the download window). Here is my DEM tile for Mount Hood area.

SRTM DEM Mount Hood OR

Create Contours from DEM

Now that you have a DEM, you can create contours from it.

  • Go to Raster menu >> Extraction >> Contours

  • In the Contour window: enter your parameters: eg. 50 meter interval, save to file as a shapefile, geopackage, dxf, etc.

Raster Create Contour

Enter your parameters (e.g. 50 meter interval, saved as shapefile), click Run then close the window when done

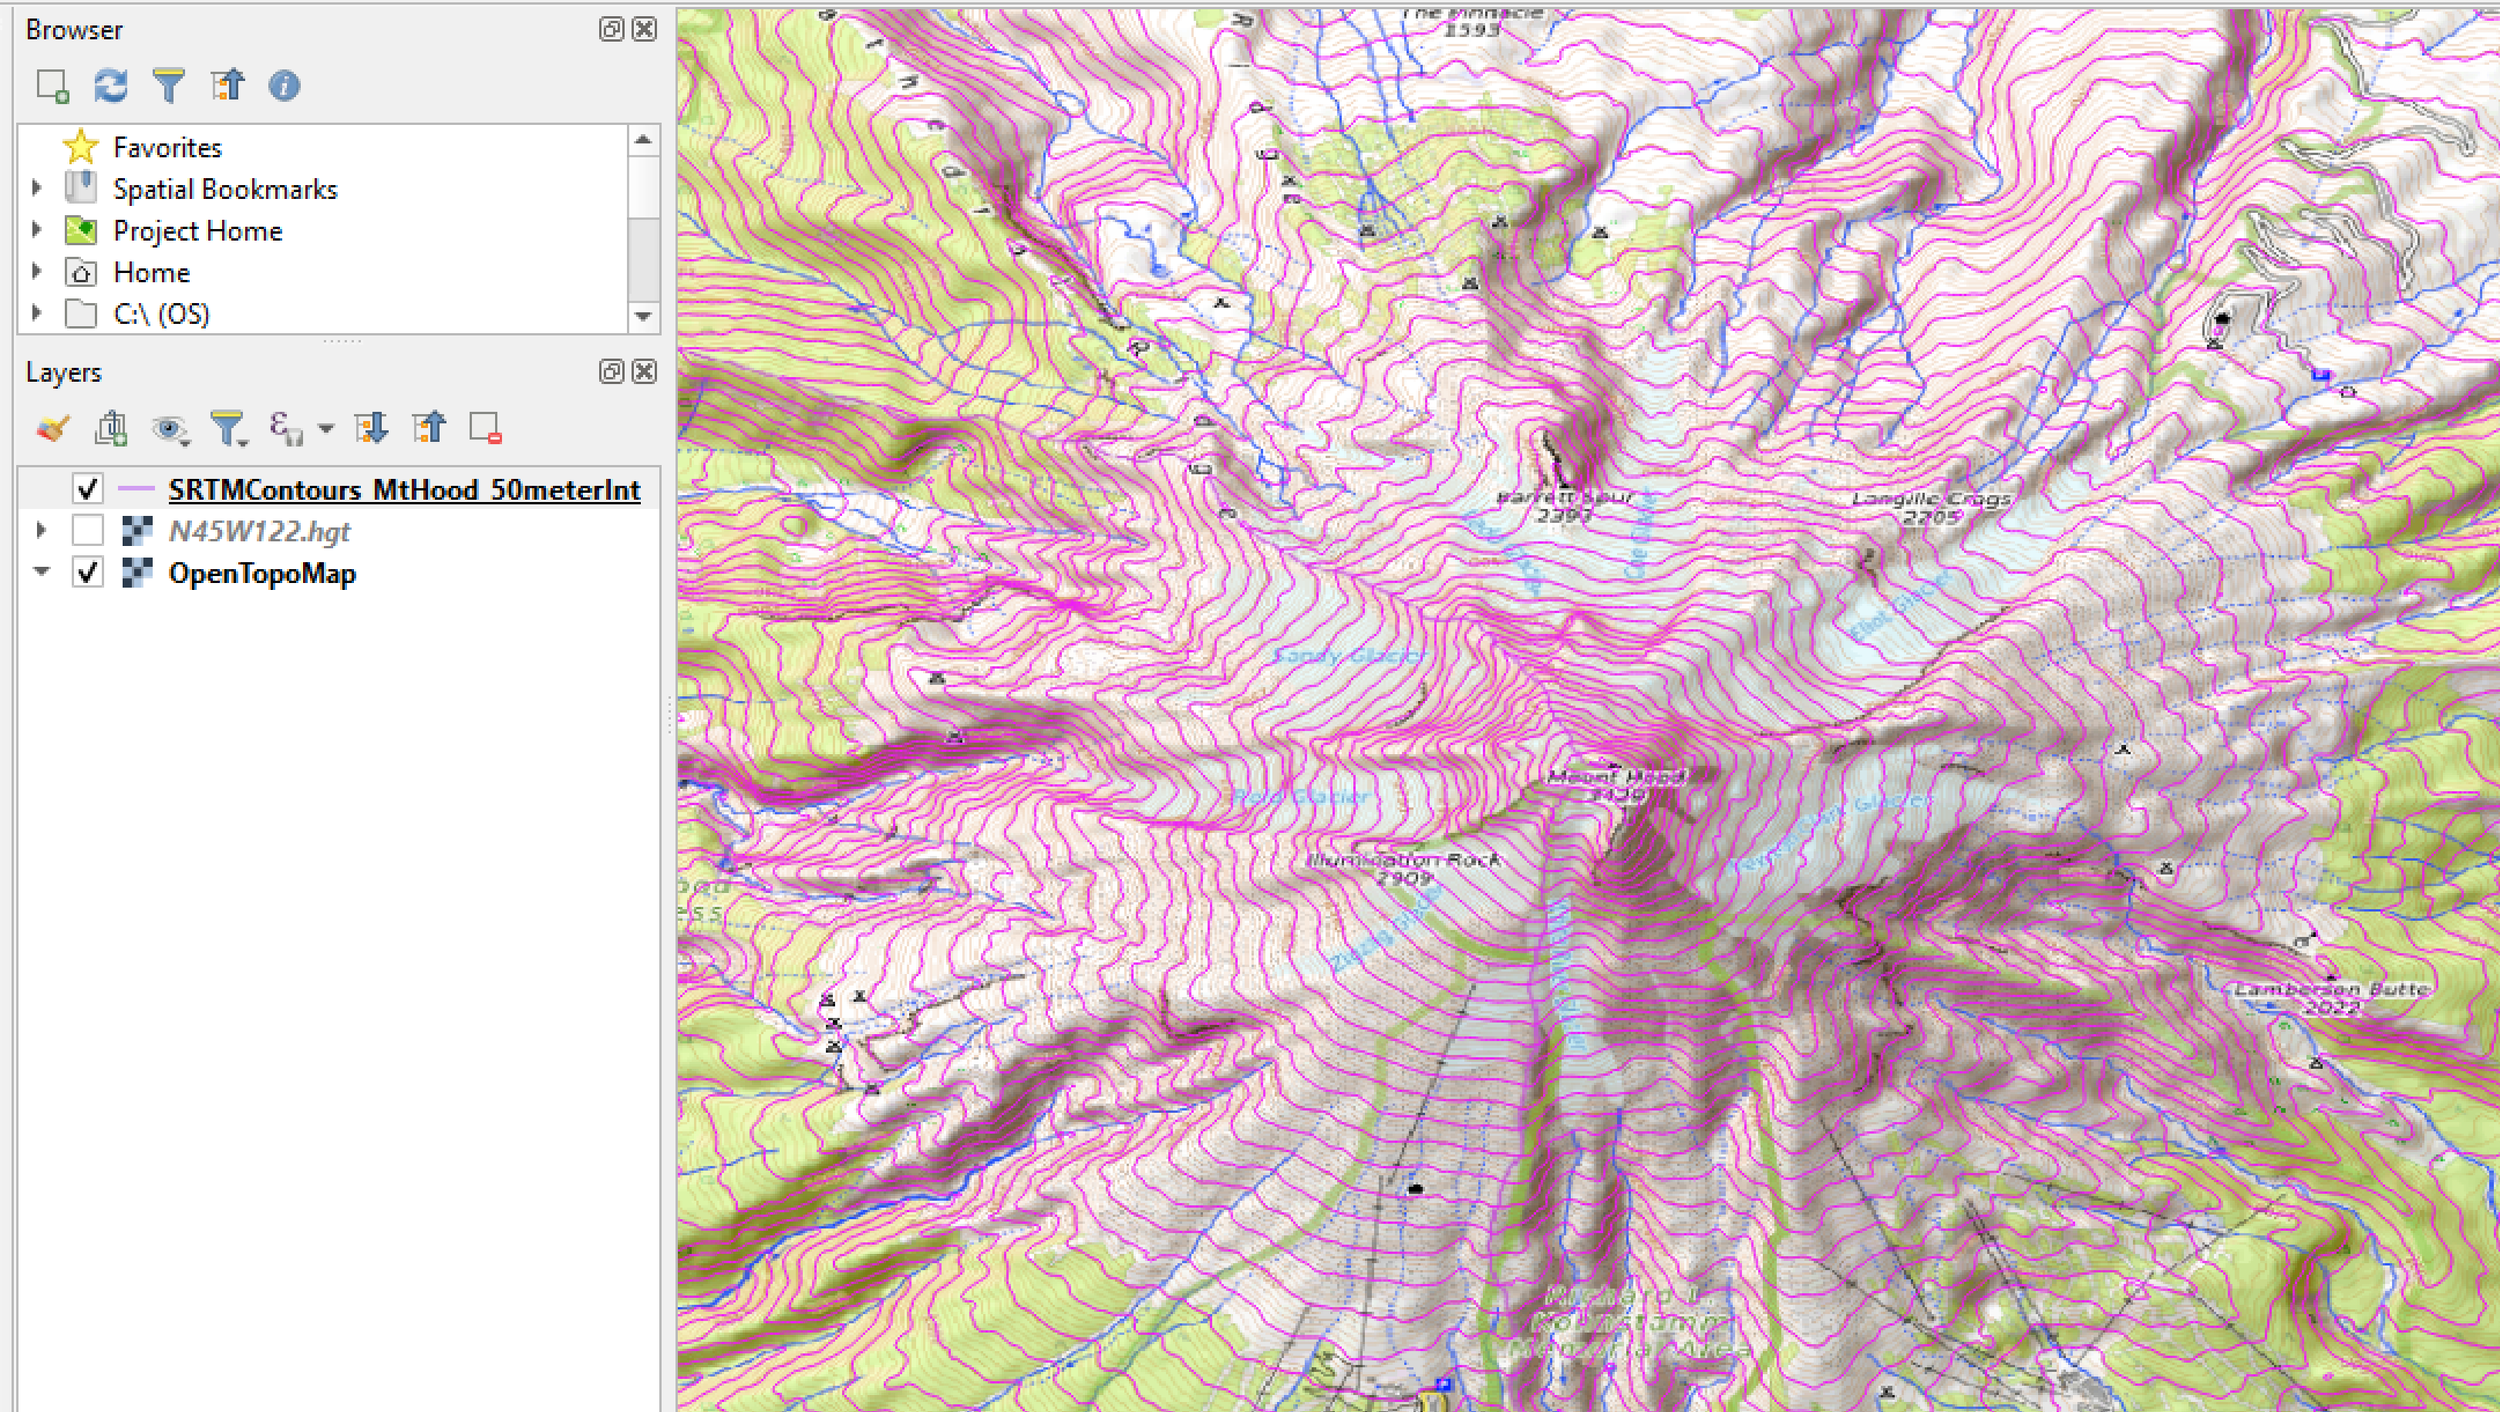
Here is my resulting contours at 50 meter interval.

Mount Hood Contours

50 meter contours (magenta lines) shown on top of OpenTopoMap

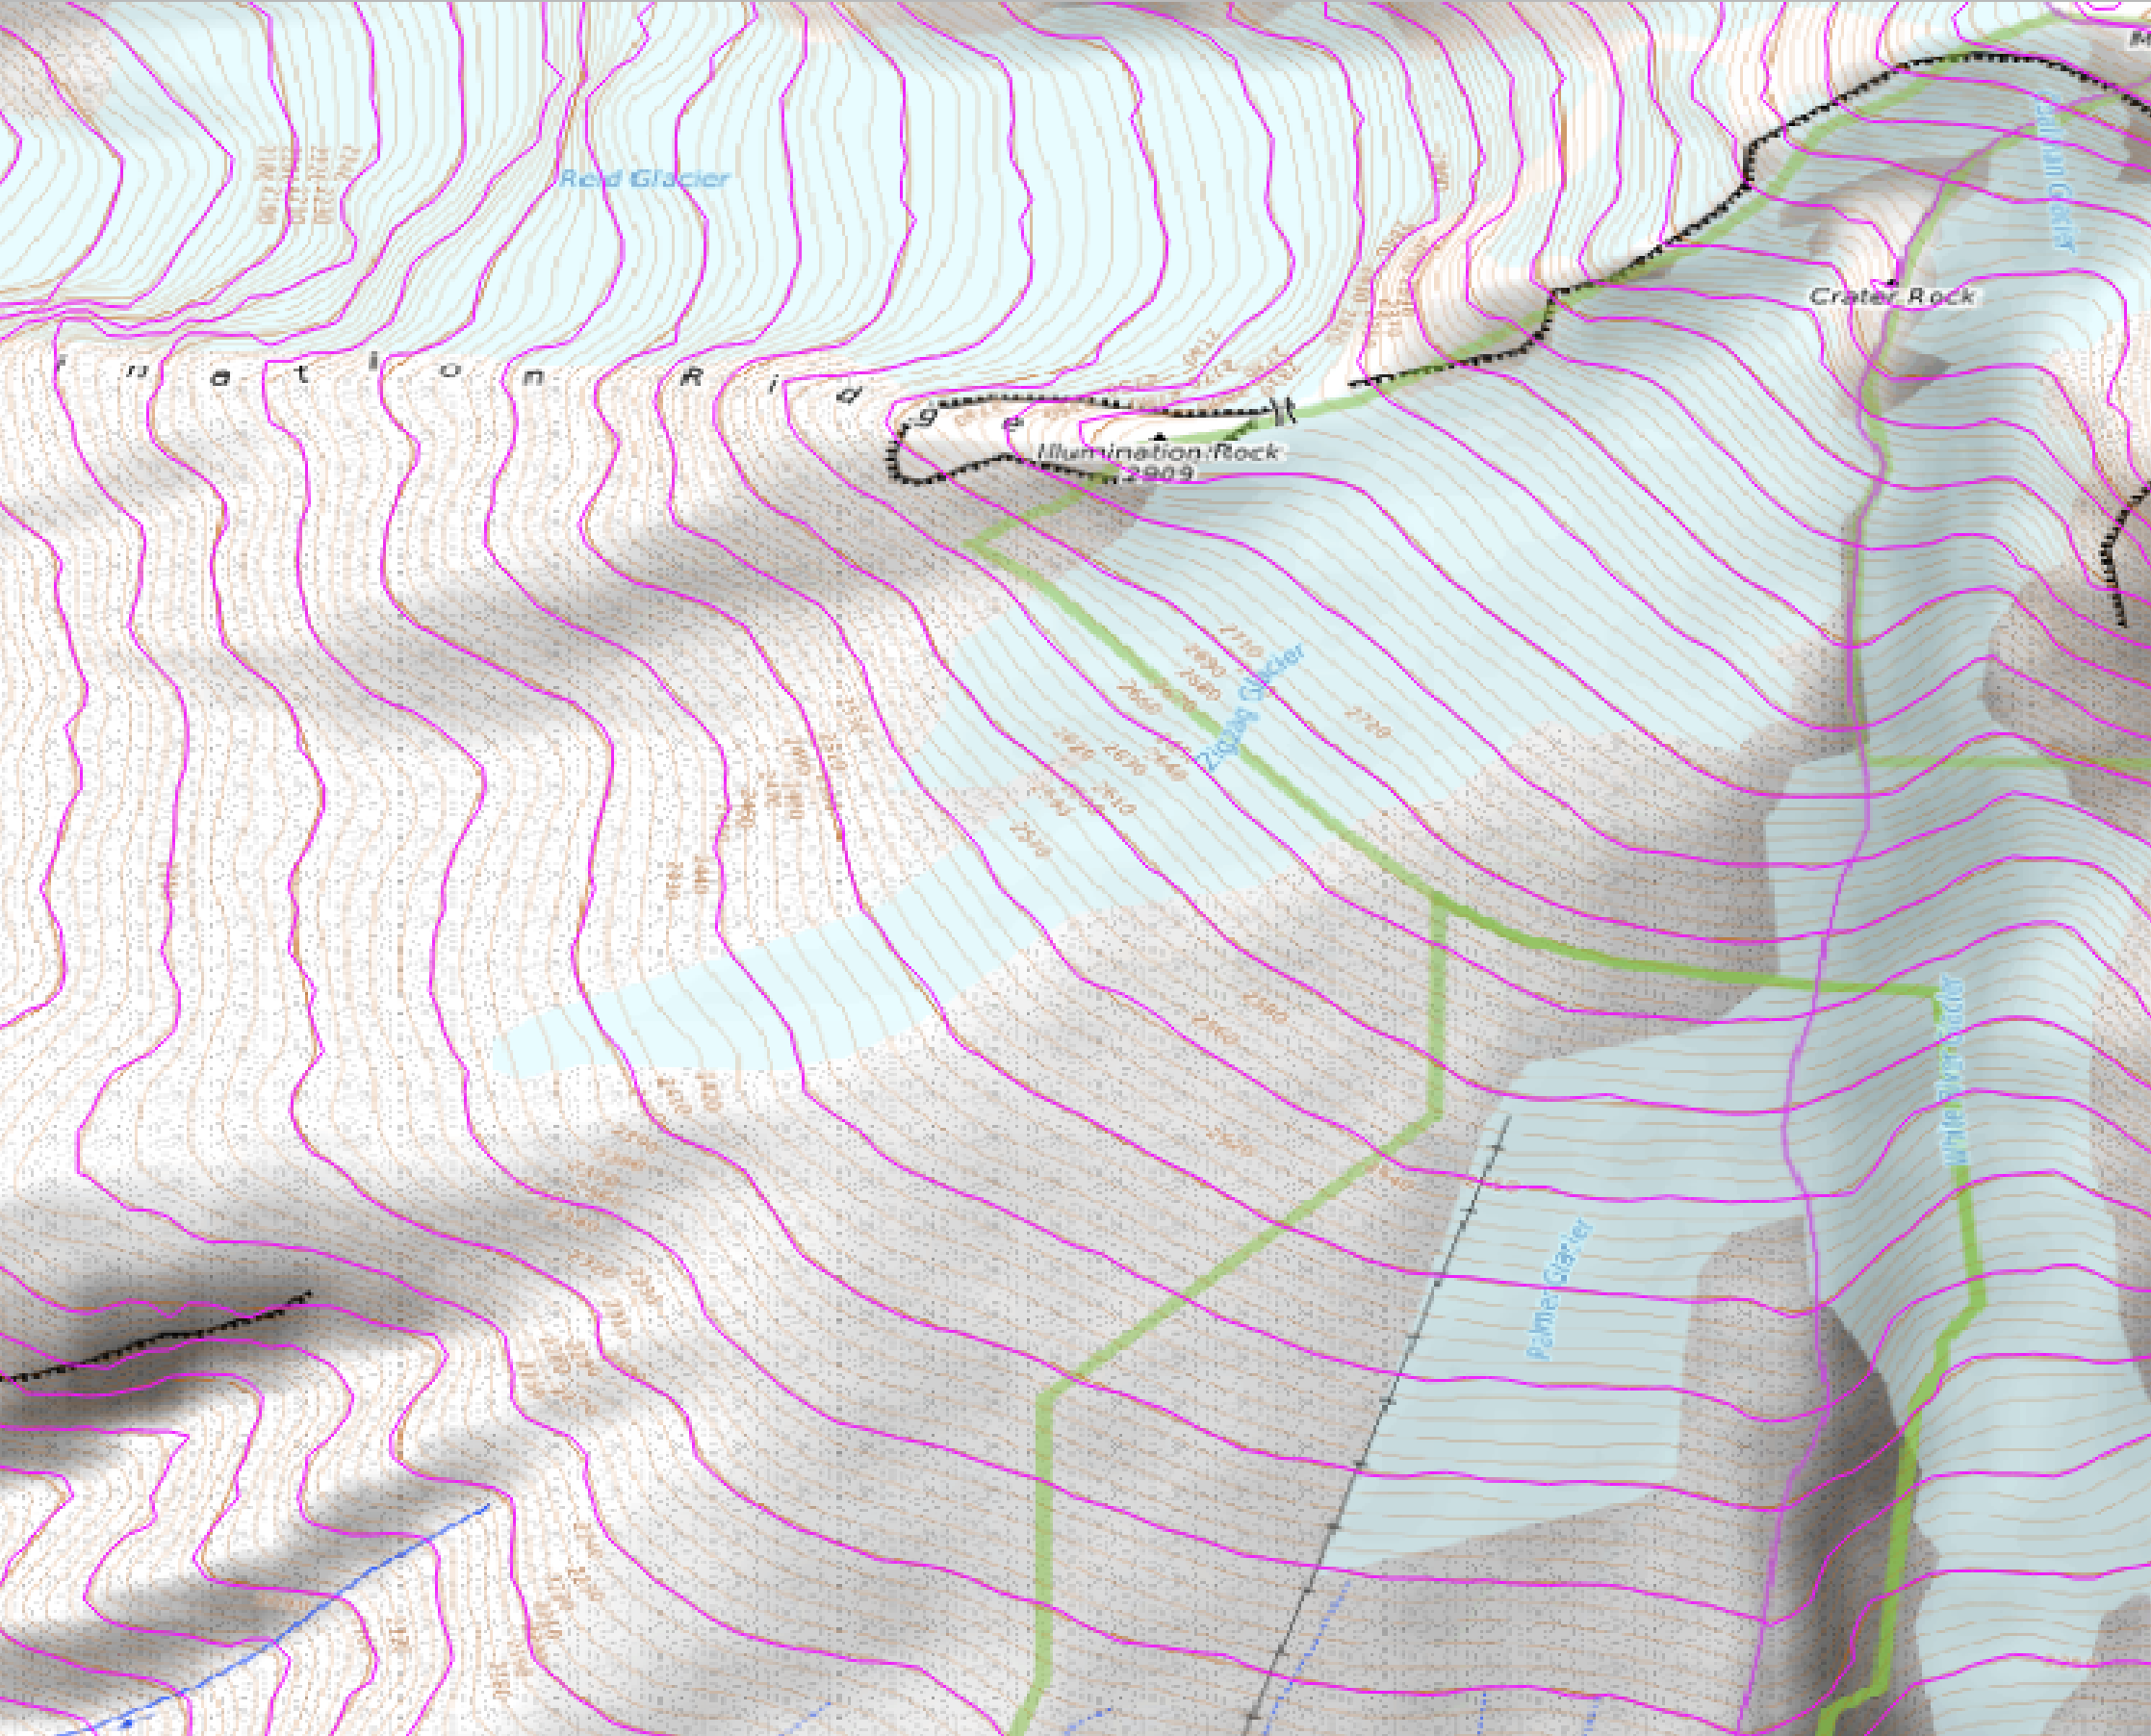
Here’s a close up view showing the contours (magenta lines) on top of OpenTopoMap - the contours generated from the SRTM DEM at 50 meters interval matches up well with the topo lines shown on the OpenTopoMap (topo lines are also derived from SRTM data).

Generated contours (magenta lines) matches the topo lines on the OpenTopoMap pretty well. Although, if you look inspect closer, the generated contours aren’t as smoothed in some areas as the OpenTopoMap lines.

That’s it for this tutorial. Thanks for reading. Until next time…

Bonus Follow Up - Tips on DEM and Contour Visualization