The other day I just happened to be looking through ESRI’s ArcUser magazine (Winter 2018) while waiting for a process to finish on my computer, and came across an article on visualizing DEM using multidirectional hillshade - Create Amazing Hillshade Effects Quickly and Easily in ArcGIS Pro. Inspired by this article, I thought I would try do the same thing in QGIS 3.0. Below is a short tutorial on how to visualize a DEM in 3D with QGIS 3.0. I'm thinking that the more I use QGIS (especially the newest update) the more I like it.
A quick note on traditional vs multidirectional hillshade:
Traditional Hillshade: hillshading illuminated from 315 deg azimuth - so only single source of light
Multidirectional Hillshade: a combination of hillshading illuminated from 225, 270, 315, and 360 deg azimuth - 4 different sources of light
1. Download DEM
First, you'll need a DEM for your area of interest. For this tutorial, I downloaded a 1 meter DEM for Diamond Head Crater from NOAA Data Access Viewer. Below is the specs I used for my download.

After you download your DEM, unzipped it. You're going to then use QGIS 3.0 to view it
2. Create Multidirectional hillshade
I am using QGIS 3.0 and I assume you have it installed already. So here's what you're going to do. First, add the DEM to the QGIS, then make a copy of it. You'll end up having 2 DEM layers for viewing purposes: 1) colored DEM used for drapping over 2) the hillshade. You are not actually creating a new layer or doing anything to the actual DEM.
In QGIS open add your DEM to the Layers Panel
Make a copy of the DEM. Right Click on your DEM >> Duplicate
Optional - In your Layers Panel, rename your second copy of the DEM to indicate that this layer will have the Hillshade effect applied to it - like the screenshot below:
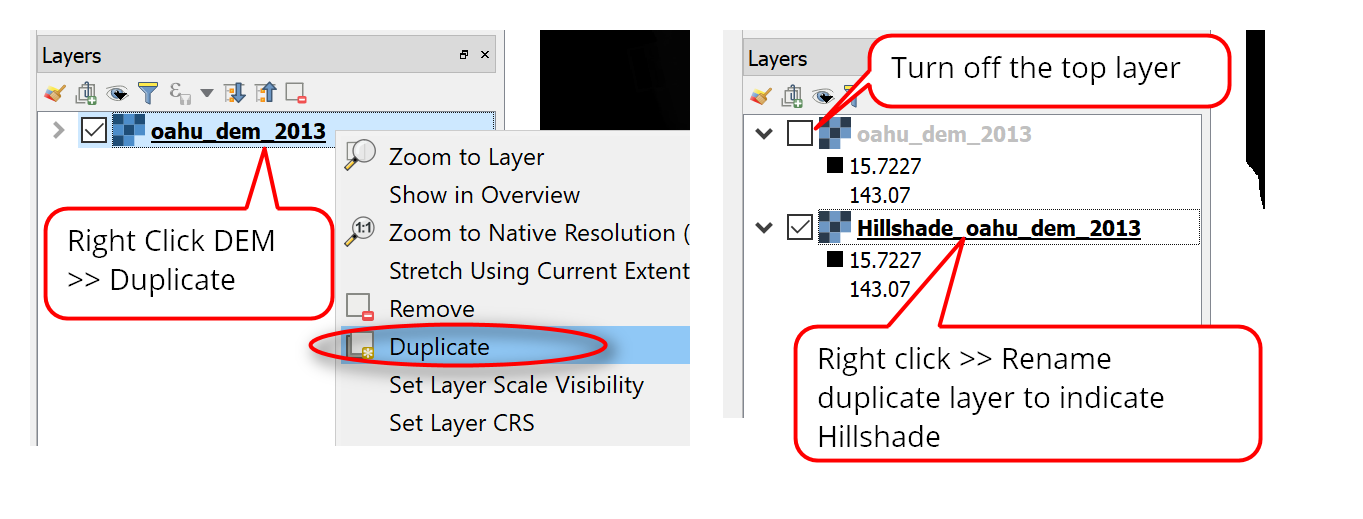
Turn off the top layer because you're going to create the hillshade effect on the second layer first.
Right click on Hillshade_oahu_dem_2013 >> Properties >> Style
Render type: Hillshade
Multidirectional: check the box
Resampling: Use either Bilinear or Cubic and Average to get a smoother looking hillshade. The default Natural Neighbor produced weird cross hatching effect.

Try to see what happens when you checked (multidirectional hillshade) and unchecking (traditional hillshade) the Multidirectional hillshade box. Here's are two views of a traditional hillshade and a multidirectional one. It looks to me like there is less shadowing in the multidirectional hillshade (which would make sense if illumination is coming from multiple directions) then the traditional one - this though I think makes it have less contrast (?) so things don't seem to pop out as much??


3. Drape Colored DEM Over Hillshade
After you create the multidirectional hillshade, you're going to just change the color of the top DEM layer and "draped" it on top.
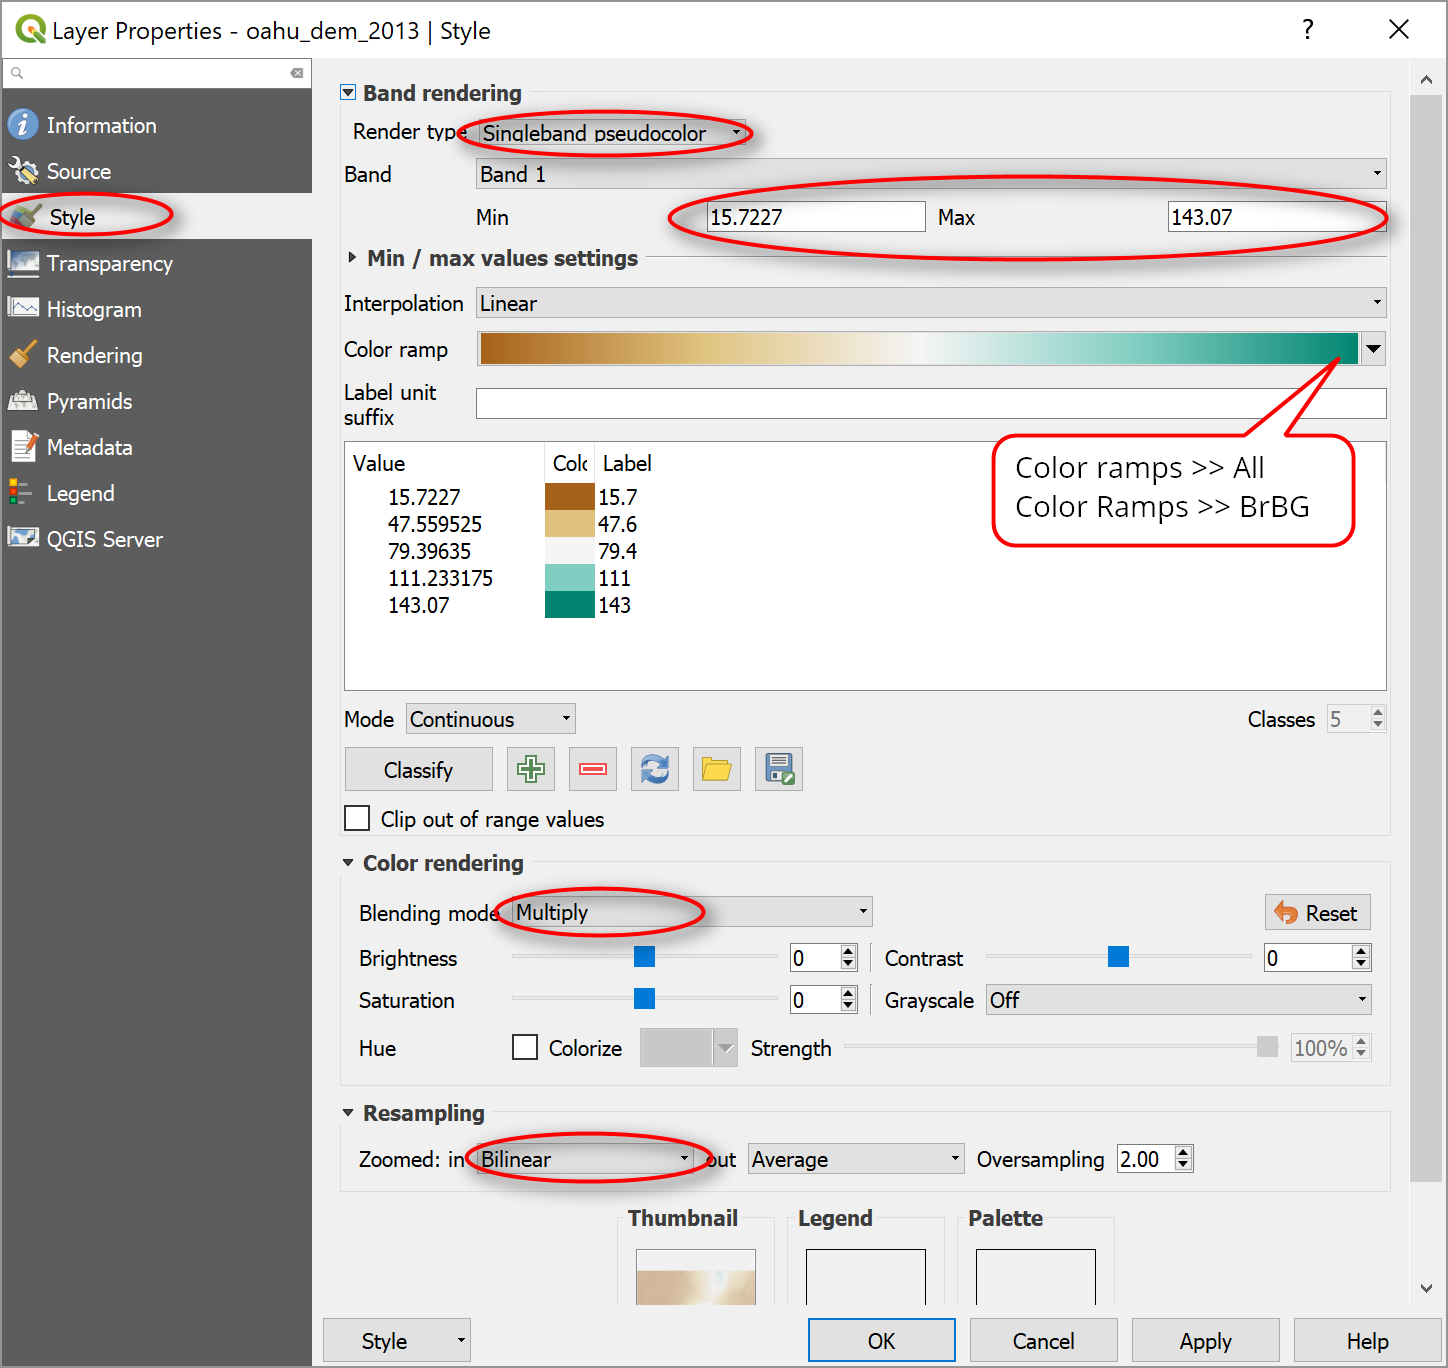
Right click on the top DEM (e.g. oahu_dem_2013) >> Properties >> Style
Rendered type: single pseudocolor
Make sure min/max values are correct for your DEM
Color ramp: Use drop down menu >> Select all Color Ramps >> BrBG (this is the one I'm using). To invert color ramp, right click inside the color box >> Invert Color
Blending mode: Multiple (this produces better effects than Normal blending with transparency)
Resampling: again use Bilinear or Cubic to get smoother effect
Optional Transparency: change transparent if you want. I have it at 50%.
Here is a view with the colored DEM draped over the multidirectional hillshade. Play around with the setting options to get your desired effect.

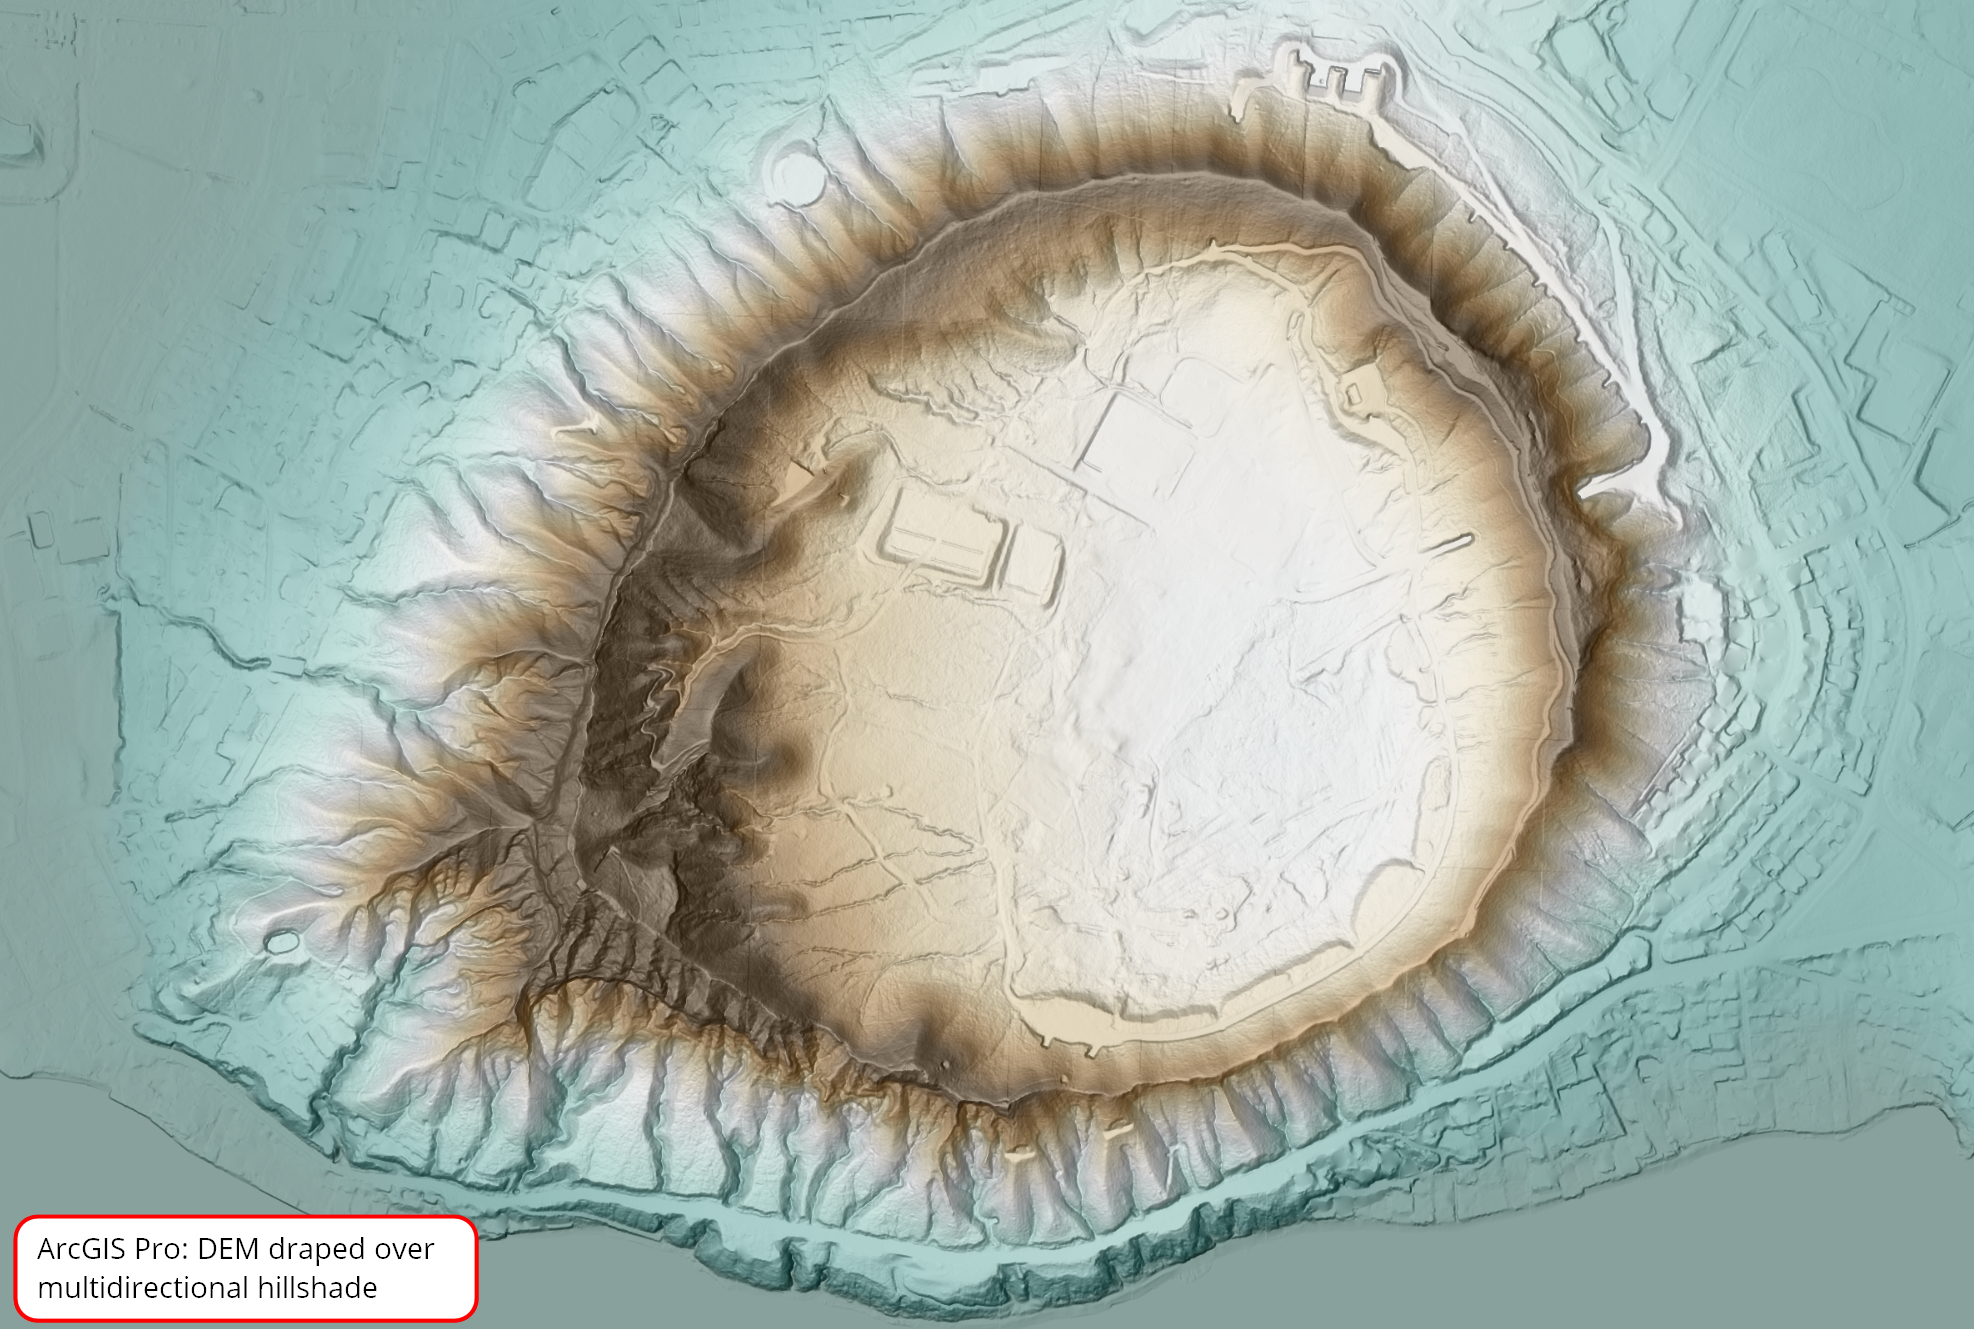
For comparison, here's the same view I did in ArcGIS Pro. Both results look really good - although I think ArcGIS Pro's multidirectional effect (using default settings) has a slight edge over the QGIS one (also using default settings).
4. Create 3D Map View
You can now view/simulate 3D landscape (DEM) in QGIS 3.0 natively without a plugin.
In QGIS, go to View menu >> New 3D Map View
In the 3D Map 1 window: click the Configure button
Elevation: select your DEM or the hillshade
Make any changes to the other settings if you want
In the 3D Map 1 window: hold down the shift key and the left mouse button to zoom in/out and rotate


Did you also know that you can customize the QGIS user interface by stacking and moving panels and map views around - try dragging and docking the panels in your user interface. The image below shows my user interface setup with the main map view or canvas on the left and the 3D Map view on the right.

Here is one of my favorite 3D visualization where I burned (Blending mode = burn) an aerial (ESRI Aerial base map) into the multidirectional hillshade in QGIS.

QGIS and ArcGIS Pro DEM Comparisons
My conclusion having used the same method for 3D DEM visualization in both QGIS 3.0 and ArcGIS Pro is that they're both very good and comparable. Of course you can do some comparisons and decide for yourself, but I think QGIS does a great job considering it is free. Anyway, below are some of my snapshots for comparison.


That's it for this post. I hope you enjoyed reading it. Feel free to drop me a note in the comments section or via email anytime.