Part 1: QGIS Server and Lizmap
NOTE: This post has been updated to include my configuration files for those who want to compare their own files with mine. You can download the files at the end of this post. Please keep in mind that I cannot guarantee that this process will work for you.
This is an updated version of my previous blog post on installing Apache, QGIS Server, and Lizweb Map on Windows OS - this time using Apache 2.4.33, QGIS Server LTR 2.18.21 and Lizmap Web Client 3.1.12. I just updated my Windows Server 2016 and needed to redo my GIS server. This post includes screenshots so hopefully it will be more helpful with details. This shows the process on my Windows 10 Pro laptop but should be the same for a Windows Server 2016 (which I've done at my work). If this helps you or if you find any errors or have any suggestions, let me know in the comments section.
For my test on my Windows 10 Pro laptop, I have everything on the same machine. But on the Windows Server 2016 machine, I have QGIS Desktop with Lizmap Web Plugin on a different machine. For my installation I put Apache and Lizmap side-by-side inside a C:/webserver directory. You can however, put your installations inside of Apache root directory (e.g. C:/Apache24/Lizmap) or inside Apache htdocs directory (e.g. C:/Apache24/htdocs/lizmap). If installation of Lizmap and Apache are side by side or Lizmap is inside Apache root directory then you need to properly configure the virtual hosts.
Software Used/Requirements:
Lizmap and QGIS Server must be on same machine
QGIS Server LTR 2.18.21 (installed via OSGeo4W x64)
QGIS Desktop (installed via OSGeo4W x64)
Lizmap Web Plugin (installed via QGIS Desktop plugin manager)
Lizmap Web Client 3.1.12
Apache 2.4.33
mod fcgid
C++ Redistributable VS 2015
PHP 7.2.7
Part 1: Set up workspace
You can choose how you set up your workspace environment, but for this guide the following setup is used.
1. Optional - turn off IIS if enabled in Windows. I have it enabled so I turned if off so I can use the default port 80.
2. Set up a home workspace on your local drive - for simplicity sake, I have a directory called webserver on my drive that I will use as my workspace (e.g. C:\webserver)
Part 2: Install and Configure Apache
For more info on using Apache for Windows - see this link: https://httpd.apache.org/docs/2.4/platform/windows.html
1. Download Apache and needed components
Go to apachelounge.com/download page and download the appropriate software for your Windows OS. Here's what I'm using:
Apache 2.4.33 Win64: httpd-2.4.33-win64-VC15.zip
mod_fcgid: mod_fcgid-2.3.9-win64-VC15.zip
Visual C Redistributable Package: vc_redist_x64
Note: The Visual C Redistributable Package is needed to run Apache HTTPD as a Windows Service but the version required will depend on which binary you are installing: If you are installing Apache 2.4 VC15 then you need Microsoft Visual Studio C 2017 Redistributable.
Be sure !! that you have installed the latest C++ Redistributable Visual Studio 2017 - Install this package first if you don't already have it installed : vc_redist_x64 or vc_redist_x86
2. Install the C++ VS 2017 redistributable that you downloaded first if you don't have it installed already
3. Extract from httpd-2.4.33-win64-VC15.zip the Apache24 folder and put into your webserver directory (e.g. C:\webserver\Apache24)
4. Extract mod_fcgid-2.3.9-win64-VC15.zip\mod_fcgid-2.3.9 folder then copy mod_fcgid.so and put into your \Apache24\modules folder (e.g. C:\webserver\Apache24\modules)
5. Change configuration in \Apache24\conf\httpd.conf file (e.g. C:\webserver\Apache24\conf\httpd.conf). In a text editor (I use notepad++) open the httpd.conf file and edit it
a. Replace all occurrences of c:/Apache24 to c:/webserver/Apache24 or where ever you have your Apache24 folder.
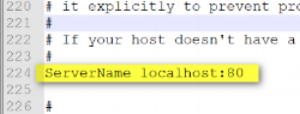
b. Find where it says “ServerName” – this should be ServerName localhost:80 (if using default port 80) or if not using default port then it should be ServerName localhost:port (e.g. ServerName localhost:90).
Uncomment the ServerName line - that is remove the # character
Change from ServerName www.example.com:80 to ServerName localhost:80
c. Optional - Find where it says “Listen 80” to and change the port number if not using the default 80 (e.g. Listen 90). You need to use a port that is not already in used by another service.
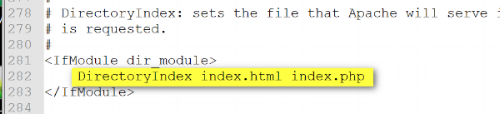
d. Find where it says “DirectoryIndex index.html” and add index.php (e.g. DirectoryIndex index.html index.php)
e. Save your changes. You can keep the configuration file open
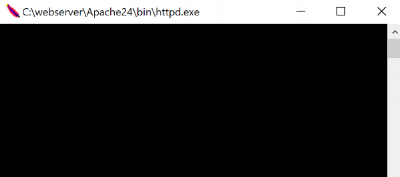
6. Check to see if Apache will start. To quickly check to see Apache configurations work and to see if Apache starts up correctly you can run the httpd.exe as a console application. You can use the command window (CMD) to run the httpd.exe or go into the directory where httpd.exe is located and run as admin.
a. Go to \Apache24\bin folder (e.g. C:\webserver\Apache24\bin) and right click on httpd.exe and run as administrator
b. If you get a pop up, allow the app to run - you should then get a console window (black window) that pops up - keep this window open (if you close it, Apache will stop)
c. Then in a web browser type in http://localhost or http:localhost:port and you should see a webpage with "It Works!" This means Apache is installed correctly
d. To stop Apache you can just close the console window (black window above)
7. Run Apache as a Windows Service rather than as a console application. Running as a service should be preferred because this lets Apache end any current operations and clean up gracefully. See https://httpd.apache.org/docs/2.4/platform/windows.html#winsvc for more info.
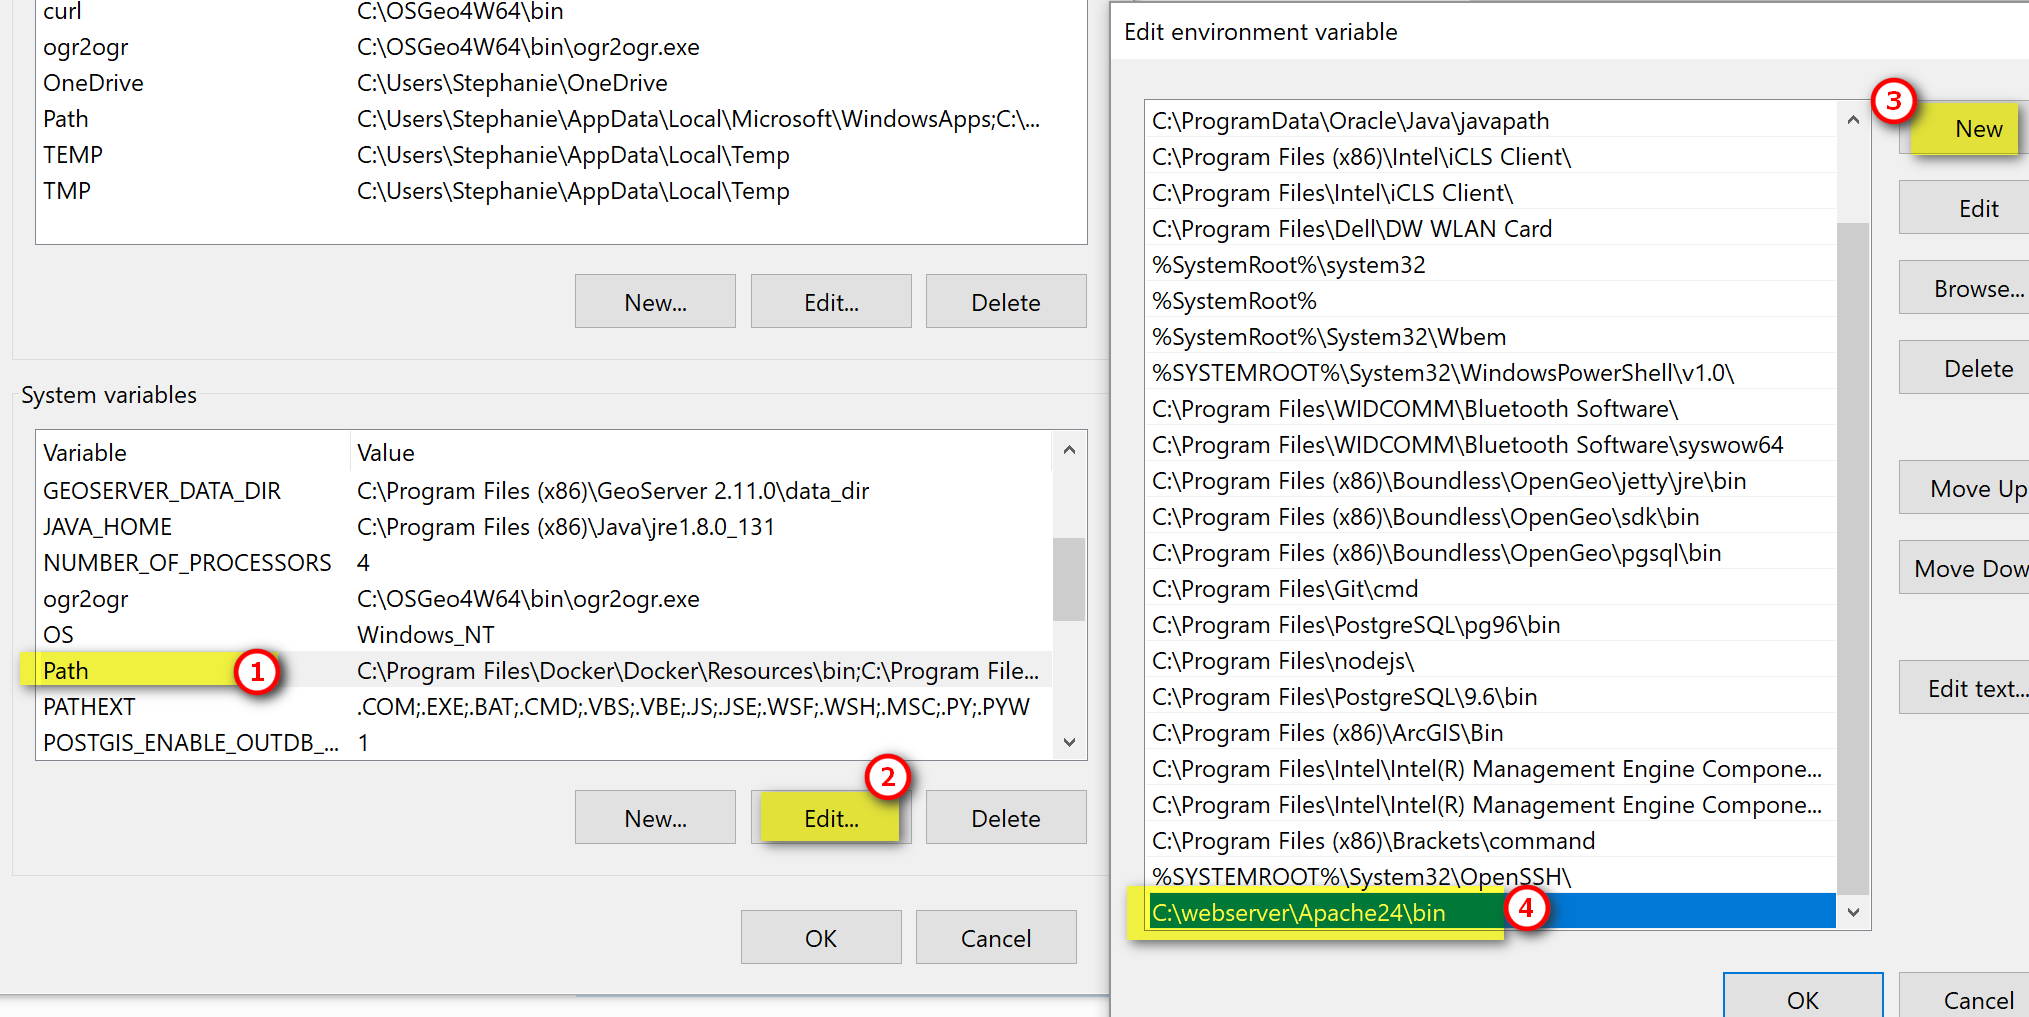
a. Optional - Append Apache to your Windows System Path so you can directly access Apache by just typing httpd.exe instead of the full pathname to it.
b. Start Apache as Windows Service:
Go to the Command Prompt (CMD) and run as administrator
Install Apache as a service: httpd.exe -k install

Open your Windows Services Manager: you should see Apache as a listed service.
Select Apache service and start it
Then in web browser, try http://localhost or http://localhost:port and you should get "It Works!"
Stop the Apache service for now as you'll do more configuration - you can keep the services window open
Note: If you would rather start, stop, restart Apache in the Command Prompt window: use httpd.exe -k restart, httpd.exe -k shutdown

8. Edit Apache configuration (httpd.conf) to enable needed modules. Open Apache24\conf\httpd.conf (e.g. C:\webserver\Apache24\conf\httpd.conf) and edit it.
a. Remove the # character in front of each of the following module to enable it.
Note: If you don't see the module already in the file then you need to type it in - for example I had to insert mod_fcgid.so module
LoadModule actions_module modules/mod_actions.so
LoadModule deflate_module modules/mod_deflate.so
LoadModule expires_module modules/mod_expires.so
LoadModule ext_filter_module modules/mod_ext_filter.so
LoadModule fcgid_module modules/mod_fcgid.so
LoadModule headers_module modules/mod_headers.so
LoadModule ident_module modules/mod_ident.so
LoadModule rewrite_module modules/mod_rewrite.so
LoadModule ssl_module modules/mod_ssl.so
Note: If you are using a different port than the default 80 then you need to also enable these modules as well.
LoadModule cache_module modules/mod_cache.so
LoadModule cache_disk_module modules/mod_cache_disk.so
LoadModule proxy_module modules/mod_proxy.so
LoadModule proxy_connect_module modules/mod_proxy_connect.so
LoadModule proxy_fcgi_module modules/mod_proxy_fcgi.so
LoadModule proxy_http_module modules/mod_proxy_http.so
b. Add the following code to the end of the httpd configuration file:
<IfModule mod_deflate.c>
SetOutputFilter DEFLATE
BrowserMatch ^Mozilla/4 gzip-only-text/html
BrowserMatch ^Mozilla/4\\.0[678] no-gzip
BrowserMatch \\bMSIE !no-gzip !gzip-only-text/html
SetEnvIfNoCase Reuqest_URI \\.(?:gif|jpe?g|png|rar|zip)$ no-gzip dont-vary
Header append Vary User-Agent env=!dont-vary
</IfModule>
9. Save your changes to the configuration file and restart Apache service. See if you can still access Apache on localhost or localhost:port. I like to restart and check after each set of configuration changes so it's easy to keep track of errors should something not work.
Part 3: Install and Configure PHP
1. Go to PHP download page and download the appropriate file for your OS and Apache version installed from Part 2. I am using PHP 7.2 (7.2.7) VC15 x64 Non Thread Safe
2. Create a new php folder, called php72 or whatever you want. Extract the zipped file contents to your PHP folder inside your main webserver directory (e.g. C:\webserver\php72).
3. In the php folder there is a php-ini-production file, make a copy of this and rename the copy to php-ini - this will be the php configuration file you edit
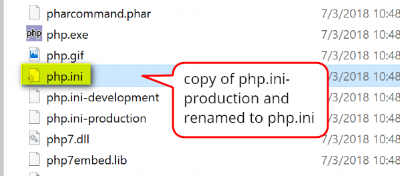
4. Open php.ini file (e.g. C:\webserver\php72\php.ini) in a text editor and make the following changes
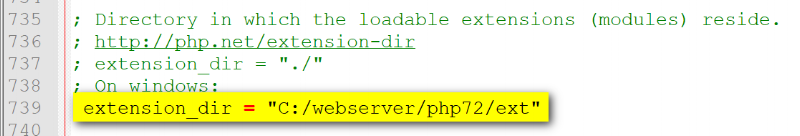
a. Find where it says ;extension_dir = "ext" and remove the ; character and replace "ext" with the path to your php ext folder (e.g. "C:/webserver/php72/ext")
b. Enable the following php modules by removing the ; character
extension=php_curl
extension=php_fileinfo.
extension=php_gd2
extension=php_mbstring
extension=php_pdo_pgsql
extension=php_pdo_sqlite.
extension=php_pgsql
extension=php_sqlite3

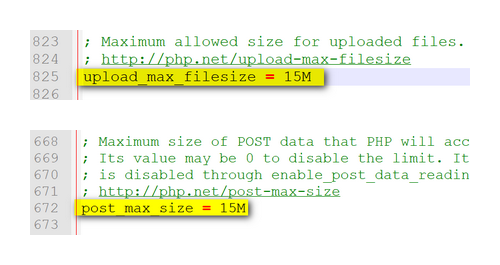
c. Find where it says "upload_max filesize" and change it to 15M
d. Find where it says "post_max_size" and change it to 15M
e. Save your configuration changes to the php.ini file
5. Add PHP to your Windows System Path (e.g. add C:\webserver\php72 to your Windows system path - same as in Part 2, step 7)
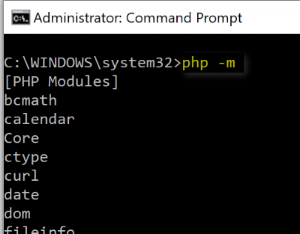
6. Open Command Prompt and check to see if PHP is correctly declared in system path: run CMD as admin, then type in php -m. You should get a list of php modules back.
Part 4: Configure Apache for Using PHP
1. Open a new file in a text editor then put in the following code - save the file as php72.conf in \Apache24\conf\extra folder (e.g. C:\webserver\Apache24\conf\extra\php72.conf)
FcgidInitialEnv PHPRC "C:\\webserver\\php72"
 <FilesMatch \\.php$>
  AddHandler fcgid-script .php
  FcgidWrapper "C:/webserver/php72/php-cgi.exe" .php
 </FilesMatch>

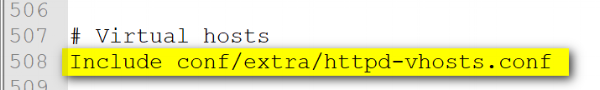
2. Open and edit Apache httpd.conf file (e.g. C:\webserver\Apache24\conf\httpd.conf)
Uncomment or remove the # character: Include conf/extra/httpd-vhosts.conf
Save changes to file
3. Open and edit httpd-vhosts.conf file (e.g. C:\webserver\Apache\Conf\extra\httpd-vhosts.conf ) for use with Lizmap
a. Delete the two examples that are included in the file and insert the following code. Note: don't forget to change the port if you're using something other then default 80
<VirtualHost *:80>
  Include conf/extra/php72.conf
  ServerName localhost
  DocumentRoot "C:/webserver/lizmap/"

  <Directory "C:/webserver/lizmap">
      Options -Indexes +FollowSymLinks +ExecCGI
      AllowOverride All
      Require all granted
  </Directory>

  CustomLog "logs/lizmap-access.log" common
  ErrorLog "logs/lizmap-error.log"
</VirtualHost>
4. Create a lizmap folder inside the main webserver directory (e.g. C:\webserver\lizmap)
5. Create a text file with following code and save it as index.php inside the lizmap folder (e.g. C:\webserver\lizmap\index.php)
<?php
    phpinfo();
?>
6. Restart Apache service
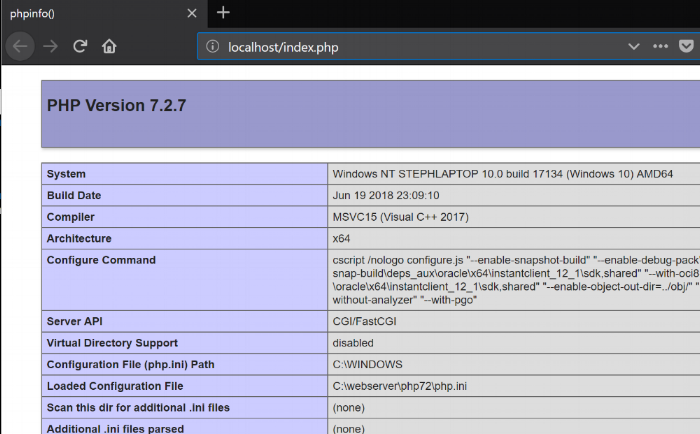
7. Check to see if PHP works. In a web browser, type in http://localhost/index.php (or http://localhost:port/index.php if not using default 80)
Part 5: Install and Configure QGIS Server
I installed QGIS Server using OSGeo4W installer x64 version – download on QGIS site or on OSGeo4W site. Lizmap Web Client doesn’t work properly with the QGIS Server 3.0 , so you must use the LTR 2.18.21. I did try with QGIS Server 3.x but it didn’t work. Note: I have both QGIS dekstop 3.2 and 2.18.21 and QGIS Server 2.18.21 on my machine and they both work fine so far.
If you don't already have QGIS desktop then you have the option to install it via Express install using the OSGeo4W installer (this is easier) or through the advance option.
1. Run the OSGeo4W installer: Select Advance Setup
a. Install from Internet
b. Keep Root Directory default and install for all users
c. Keep default Local Package Directory and Start Menu Name
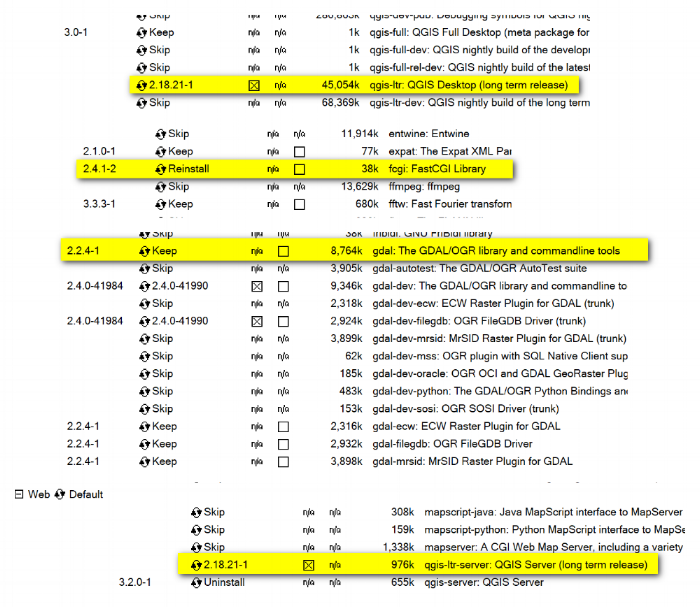
d. Select these Packages:
Commandline_Utilities: GDAL
Desktop: QGIS LTR 2.18.21 full (if needed)
Libs: fcgi
Optional Lib: filegdb (only if you want to be able to use ESRI file gdb)
Web: QGIS Server LTR 2.18.21
e. Resolve Un-met Dependencies: Install the required dependencies, accept license agreements, and allow installation to complete
2. After installation completes, check in C:\OSGeo4W64\apps\qgis-ltr\bin folder to make sure these files are in there.
qgis_mapserv.fcgi.exe
qgis_server.dll
wms_metadata.xml
3. Configure QGIS server to be accessible as fcgi. Open httpd-vhosts.conf file (e.g. C:\webserver\Apache\Conf\extra\httpd-vhosts.conf ) and edit it to contain the following code. Save the file when done.
<VirtualHost *:80>
  Include conf/extra/php72.conf
  ServerName localhost

# Lizmap Production
DocumentRoot "C:/webserver/lizmap/prod/"
<Directory "C:/webserver/lizmap/prod">
    Options -Indexes +FollowSymLinks +ExecCGI
    AllowOverride All
    Require all granted
</Directory>

# LizMap Pre-production
Alias /preprod/ "C:/webserver/lizmap/preprod/"
<Directory "C:/webserver/lizmap/preprod">
    Options -Indexes +FollowSymLinks +ExecCGI
    AllowOverride All
    Require all granted
</Directory>

Alias /qgis/ "C:/OSGeo4W64/apps/qgis-ltr/bin/"
<Directory "C:/OSGeo4W64/apps/qgis-ltr/bin/">
    SetHandler fcgid-script
    Options +ExecCGI
    AllowOverride All
    Require all granted
</Directory>

Alias /document/ "C:/webserver/data/document/"
<Directory "C:/webserver/data/document">
    Options -Indexes +FollowSymLinks
    AllowOverride All
    Require all granted
</Directory>

CustomLog "logs/lizmap-access.log" common
ErrorLog "logs/lizmap-error.log"
</VirtualHost>
4. Open php72.conf that you created earlier (e.g. C:\webserver\Apache24\conf\extra\php72.conf) and modify it to include the following code. Save your changes to the file.
FcgidInitialEnv PHPRC "C:\\webserver\\php72"

FcgidInitialEnv PATH "C:\OSGeo4W64\bin;C:\OSGeo4W64\apps\qgis-ltr\bin;C:\OSGeo4W64\apps\grass\grass-6.4.3\lib;C:\OSGeo4W64\apps\grass\grass-6.4.3\bin;C:\Windows\system32;C:\Windows;C:\Windows\System32\WBem"
 FcgidInitialEnv QT_PLUGIN_PATH "C:\OSGeo4W64\apps\qgis-ltr\qtplugins;C:\OSGeo4W64\apps\Qt4\plugins"
 FcgidInitialEnv PYTHONHOME "C:\OSGeo4W64\apps\Python27"
 FcgidInitialEnv PYTHONPATH "C:\OSGeo4W64\apps\qgis-ltr\.\python;C:\OSGeo4W64\apps\qgis-ltr\.\python\plugins;C:\OSGeo4W64\apps\Python27\DLLs;C:\OSGeo4W64\apps\Python27\lib;C:\OSGeo4W64\bin;C:\OSGeo4W64\apps\Python27;C:\OSGeo4W64\apps\Python27\lib\site-packages"

FcgidInitialEnv QGIS_SERVER_LOG_LEVEL 0
FcgidInitialEnv QGIS_SERVER_LOG_FILE "C:\\webserver\\Apache24\\logs\\qgis_server.log"

FcgidIOTimeout 120
      FcgidInitialEnv LC_ALL "en_US.UTF-8"
      FcgidInitialEnv PYTHONIOENCODING UTF-8
      FcgidInitialEnv LANG "en_US.UTF-8"
      FcgidInitialEnv QGIS_DEBUG 1
      FcgidInitialEnv QGIS_SERVER_LOG_FILE "C:\\webserver\Apache24\logs\\qgis_server.log"
      FcgidInitialEnv QGIS_SERVER_LOG_LEVEL 0
      FcgidInitialEnv QGIS_PLUGINPATH "C:\OSGeo4W64\apps\qgis-ltr\python\plugins"

SetEnvIf Request_URI ^/qgis QGIS_PREFIX_PATH "C:\OSGeo4W64\apps\qgis-ltr"
SetEnvIf Request_URI ^/qgis TEMP "C:\Windows\Temp"

SetEnvIf Request_URI ^/qgis GDAL_DATA "C:\OSGeo4W64\share\gdal"
SetEnvIf Request_URI ^/qgis GDAL_DRIVER_PATH "C:\OSGeo4W64\bin"
SetEnvIf Request_URI ^/qgis PDAL_DRIVER_PATH "C:\OSGeo4W64\bin"
SetEnvIf Request_URI ^/qgis GDAL_SKIP "JP2ECW"
SetEnvIf Request_URI ^/qgis PROJ_LIB "C:\OSGeo4W64\share\proj"

 <FilesMatch \.php$>
  AddHandler fcgid-script .php
  FcgidWrapper "C:/webserver/php72/php-cgi.exe" .php
 </FilesMatch>
5. Restart Apache Service
6. In a web browser, see if you can access the QGIS Server:
Note: Typing in the following as noted in the Lizmap installation documentation: http://localhost/qgis/qgis_mapserv.fcgi.exe will give you an error "Service unknown or unsupported"
Type in this below: you should see the default content of the wms_metadata.xml file - this means QGIS Server was installed correctly and accessed as fcgi.
http://localhost/qgis/qgis_mapserv.fcgi.exe?SERVICE=WMS&VERSION=1.3.0&REQUEST=GetCapabilities
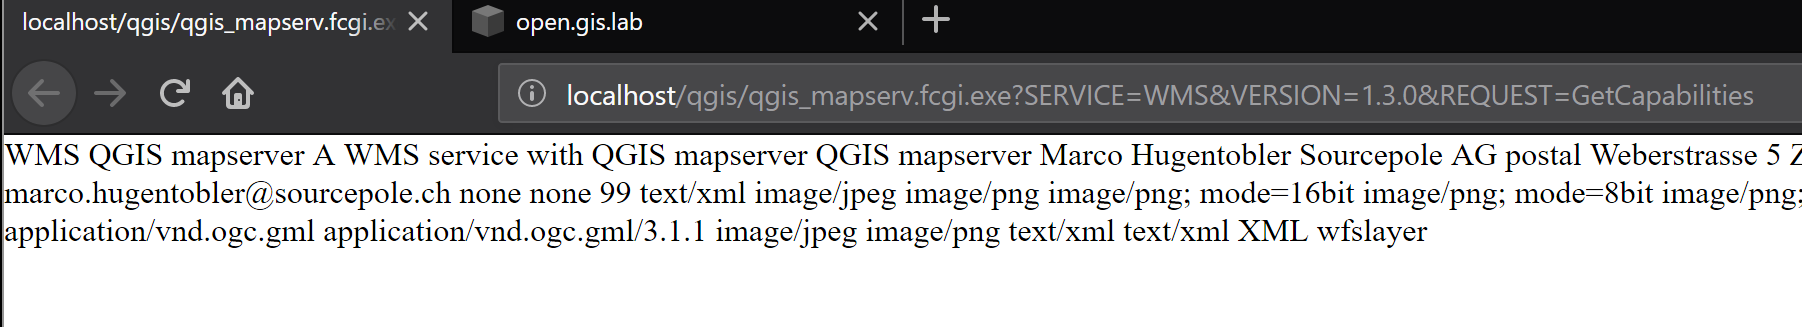
NOTE (2/18/2019): You may also get something like “This XML file does not appear to have any style information associated with it. The document tree is shown below.” You should still be ok as long as you are not getting a “SERVICE UNKNOWN or UNSUPPORTED” error.
The image below looks different than the one above - the wms_metadata.xml for QGIS server may be slightly different from when I wrote the blog post. So just keep in mind that if you are getting some sort of descriptive text back about the WMS service and not an actual error then you are ok and can proceed.
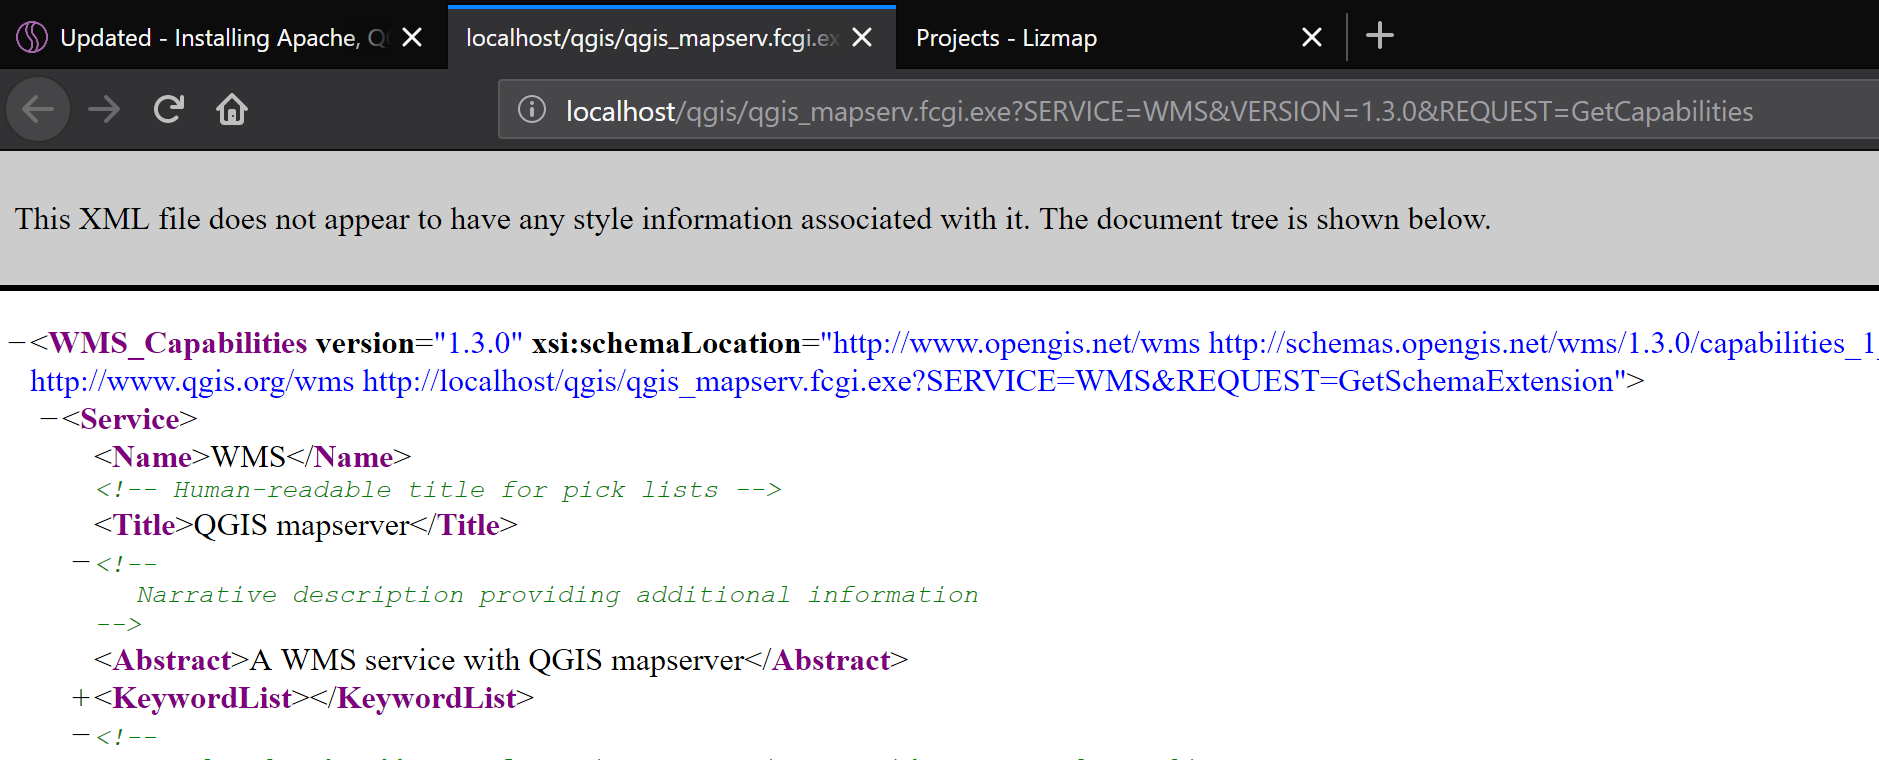
If you get something that looks like this you are ok - your QGIS Server installation is ok.
Part 6: Install and Configure Lizmap Web Client
1. Download Lizmap Web Client – I used lizmap-web-client-3.1.12.zip.
2. Create in C:\webserver\lizmap directory, 2 new folders for your production and preproduction work. Make sure you have write access to these folders
C:\webserver\lizmap\prod
C:\webserver\lizmap\preprod
3. Create in C:\webserver directory a new cache directory to hold 2 new subfolders: prod and preprod. Make sure you have write access to these folders
C:\webserver\cache\prod
C:\webserver\cache\preprod
4. Unzip or extract lizmap-web-client-3.1.12zip to C:\webserver\lizmap\prod directory. So what you end up having is C:\webserver\lizmap\prod\lizmap-web-client-3.1.12
5. Open C:/webserver/Apache24/conf/extra/httpd-vhosts.conf in text editor and modified the section to the virtual host to point to C:/webserver/lizmap/prod/lizmap-web-client-3.1.12/lizmap/www folder - like the content below
<VirtualHost *:80>
  Include conf/extra/php72.conf
  ServerName localhost

# Lizmap Production
DocumentRoot "C:/webserver/lizmap/prod/lizmap-web-client-3.1.12/lizmap/www/"
<Directory "C:/webserver/lizmap/prod/lizmap-web-client-3.1.12/lizmap/www/">
    Options -Indexes +FollowSymLinks +ExecCGI
    AllowOverride All
    Require all granted
</Directory>

# LizMap Pre-production
Alias /preprod/ "C:/webserver/lizmap/preprod/lizmap-web-client-3.1.12/lizmap/www/"
<Directory "C:/webserver/lizmap/preprod/lizmap-web-client-3.1.12/lizmap/www/">
    Options -Indexes +FollowSymLinks +ExecCGI
    AllowOverride All
    Require all granted
</Directory>

Alias /qgis/ "C:/OSGeo4W64/apps/qgis-ltr/bin/"
<Directory "C:/OSGeo4W64/apps/qgis-ltr/bin/">
    SetHandler fcgid-script
    Options +ExecCGI
    AllowOverride All
    Require all granted
</Directory>

Alias /qgis/ "C:/OSGeo4W64/apps/qgis-ltr/bin/"
<Directory "C:/OSGeo4W64/apps/qgis-ltr/bin/">
    SetHandler fcgid-script
    Options +ExecCGI
    AllowOverride All
    Require all granted
</Directory>

# ABP: needed for authentication in Lizmap
<IfModule mod_fcgid.c>
    RewriteEngine on
    RewriteCond % .
    RewriteRule .* - [E=HTTP_AUTHORIZATION:%]
</IfModule>

CustomLog "logs/lizmap-access.log" common
ErrorLog "logs/lizmap-error.log"

</VirtualHost>
6. Restart Apache Service
7. Open the Command Prompt window (run as Administrator) and type in the following lines - for copying some lizmap files
cd C:\\webserver\\lizmap\\prod\\lizmap-web-client-3.1.12\\
cd lizmap/var/config
copy lizmapConfig.ini.php.dist lizmapConfig.ini.php
copy localconfig.ini.php.dist localconfig.ini.php
copy profiles.ini.php.dist profiles.ini.php
cd ../../..
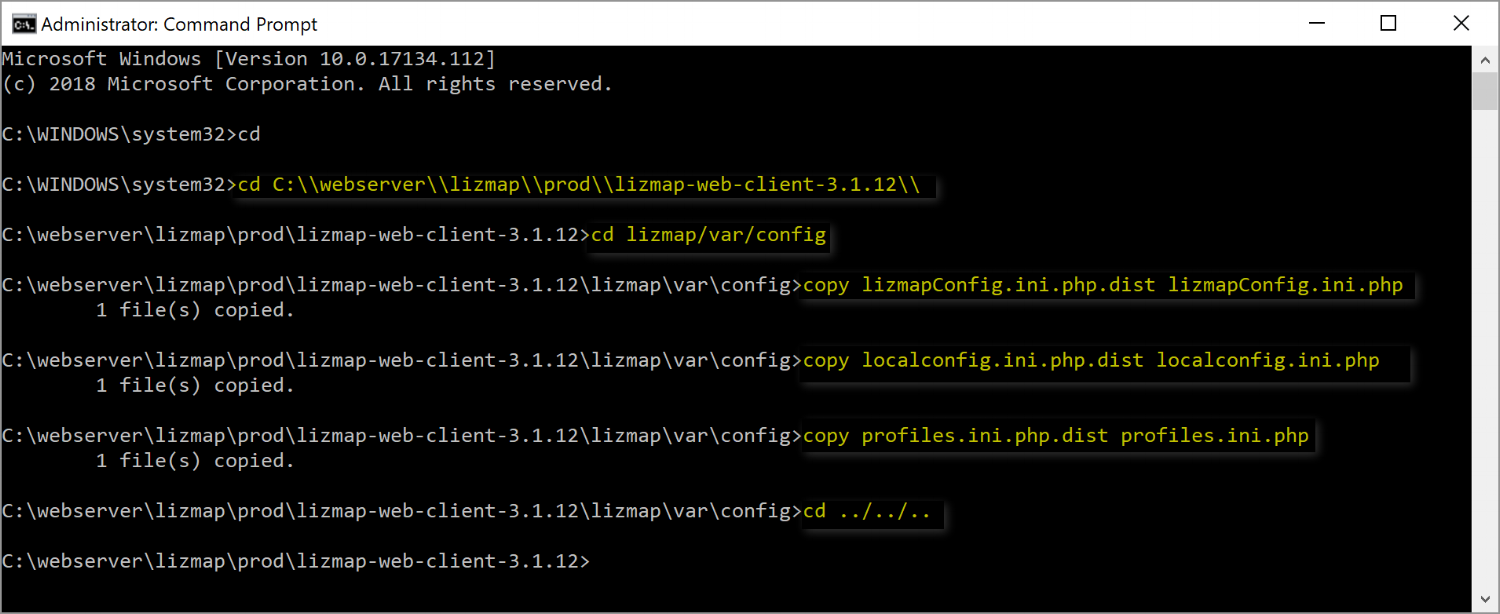
8. Keep your command prompt window open
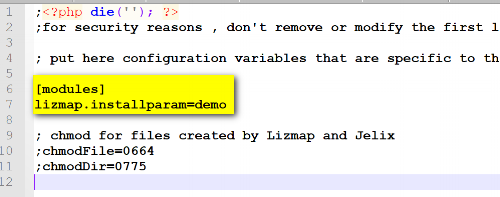
9. Open Lizmap's localconfig.ini.php file (e.g. C:\webserver\lizmap\prod\lizmap-web-client-3.1.12\lizmap\var\config\localconfig.ini.php) in a text editor and include the following code if you want to install the Lizmap demo websites – make sure you have admin rights to modify and save this file (e.g. run notepad++ as Administrator then modify and save changes).
[modules]
lizmap.installparam=demo
10. Back in the Command Prompt, launch Lizmap installation by typing in the following lines. After installation completes, close the command prompt window.
cd C:\webserver\lizmap\prod\lizmap-web-client-3.1.12\
php lizmap/install/installer.php
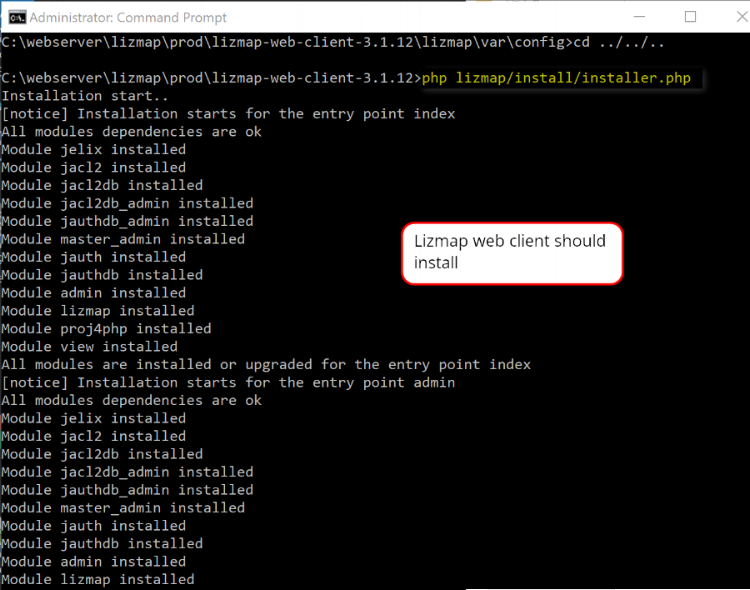
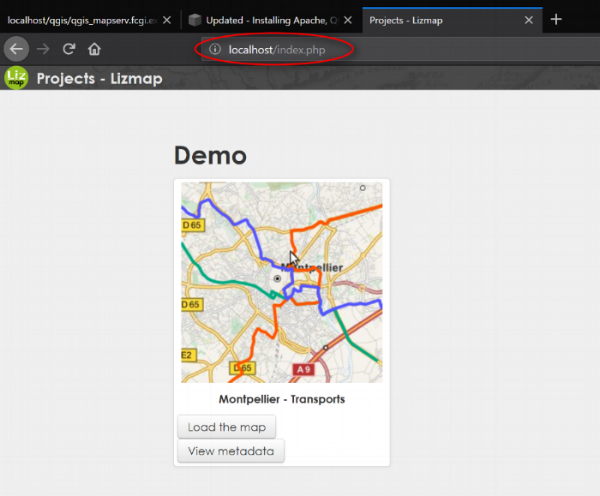
11. In web browser, type in http://localhost/index.php - you should see the Lizmap demo page
The Lizmap Web Client Dashboard
1. In the Lizmap home page (see above image), click the Connect button in the top right or go to http://localhost/admin.php to access the login page:
Login with default username = admin, password = admin
2. Once you log in you can see the Admin dashboard, don't forget to change password (in My Account). Notice there is an additional intranet demo in the dashboard

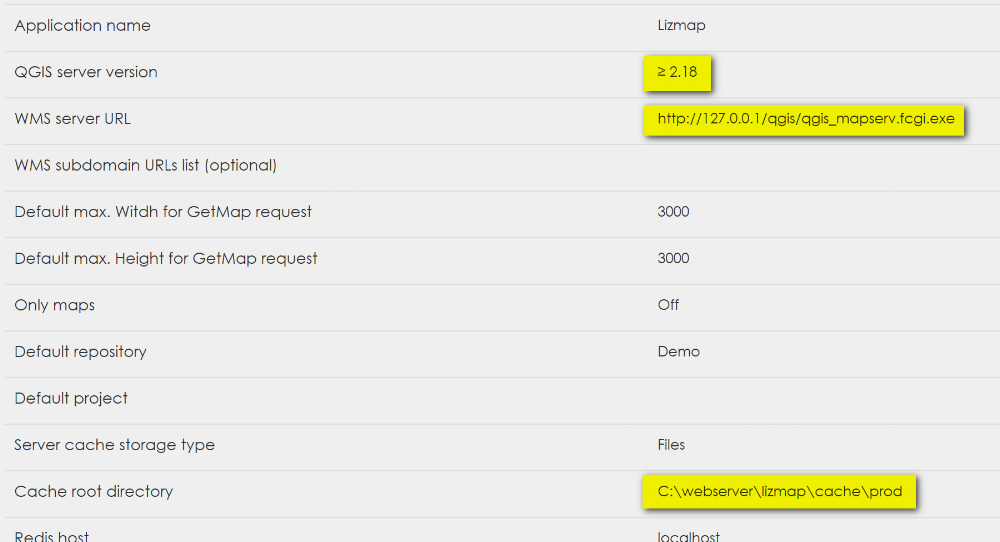
3. Lizmap Configuration menu: Modify the Lizmap generic configuration - input as follows and then save new configuration.
QGIS server version: >= 2.18
WMS Server URL: http://127.0.0.1/qgis/qgis_mapserv.fcgi.exe
Cache root directory: C:/webserver/cache/prod/
Note: if you get a error when trying to update the cache root directory to the folder that you created earlier - make sure you have write access to the location first then reload Lizmap demo again.
4. Click over to PROJECTS (top right corner) and you can view the metadata of the demo or load the demo map
Here is the Montpellier Demo web app.

Part 7: SVG and QGIS Bug
I’m not sure if this still hold true or not, but not a bad idea to do it. In Apache you need to Add a vhost to publish SVG and images files via HTTP this will avoid the bug in QGIS Server under Windows which cannot display SVG icon when you have a relative path.
1. Create a folder to contain the svg files (e.g. C:/webserver/data/document/svg)
2. Then modify C:/webserver/Apache24/conf/extra/httpd-vhosts.conf . Add the codes before the CustomLog portion.
Alias /document/ "C:/webserver/data/document/"
<Directory "C:/webserver/data/document/">
    Options -Indexes +FollowSymLinks
    AllowOverride All
    Require all granted
</Directory>
3. Save and restart Apache service.
4. Check if you can add svg file in the folder C:/webserver/webapp/document/svg then access it via http://localhost/document/svg/my_icon.svg and use it as the SVG path in the style properties of a vector layer.
That's it for this post. I hope this helps you get your GIS server running. See Lizmap Documentation for more info on configuration and user/publisher manual.
DOWNLOAD CONFIGURATION FILES FOR COMPARISON WITH YOUR OWN FILES:
These have *.txt file extension to them for downloading purpose.
See Part 2 - on how to use the Lizmap plugin for QGIS to prepare and publish a QGIS project. If you've read this entire post then thank you for reading and I hope it worked out for you. Until next time.