Today’s post is inspired by Joseph Kerski, who works at ESRI doing GIS in Education. You can read his post on Using the Photos with Locations Tool in Education. It provides some very useful information for on using ESRI software (AGOL) to map and view geotagged photos. We had an interesting discussion on teaching GIS in the academia (although I am no longer in academia - I still enjoy teaching and doing trainings). You can get a free public ArcGIS Online (AGOL) account if you’d like to give it a try. If you are a student, you can look into the Learn ArcGIS Student Program (launching September 1, 2020) that gives qualified students free access to AGOL and ArcGIS Pro for a year through a membership in the Learn ArcGIS organization. I think it’s good idea to learn both ArcGIS and QGIS.
Anyway, enough on ArcGIS. I thought I would a complementary posting on mapping and viewing geotagged photos in QGIS. If you have a need to map and view your geotagged photos then this post is for you. A geotagged photo has associated geographic location added to it by a process called geotagging. The geographic information (latitude, longitude, altitude, bearing or direction, and date/time stamp, etc.) are stored in the image’s EXIF header. If you have ever taken photos with your smartphone then most likely your photos as geotagged (assuming geolocation is enabled on your phone). Geotagged photo can be mapped and viewed in QGIS.
The only requirement to this short tutorial is that you must have photos that are already geotagged. Also, if you wan to create a web map then you need to have qgis2web plugin installed. As for QGIS version, I am using QGIS 3.14 Pi.
Step 1: Import Geotagged Photos
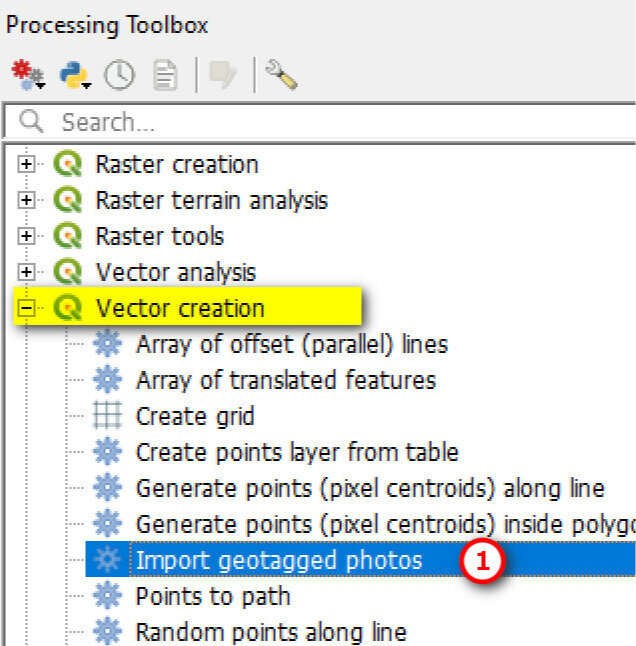
In QGIS: Go to the Processing Toolbar panel. If you don’t see the Processing Toolbar Panel then go to Processing Menu >> Toolbar.

In the Processing Toolbar panel >> Vector Creation >> Double click on Import Geotagged Photos.
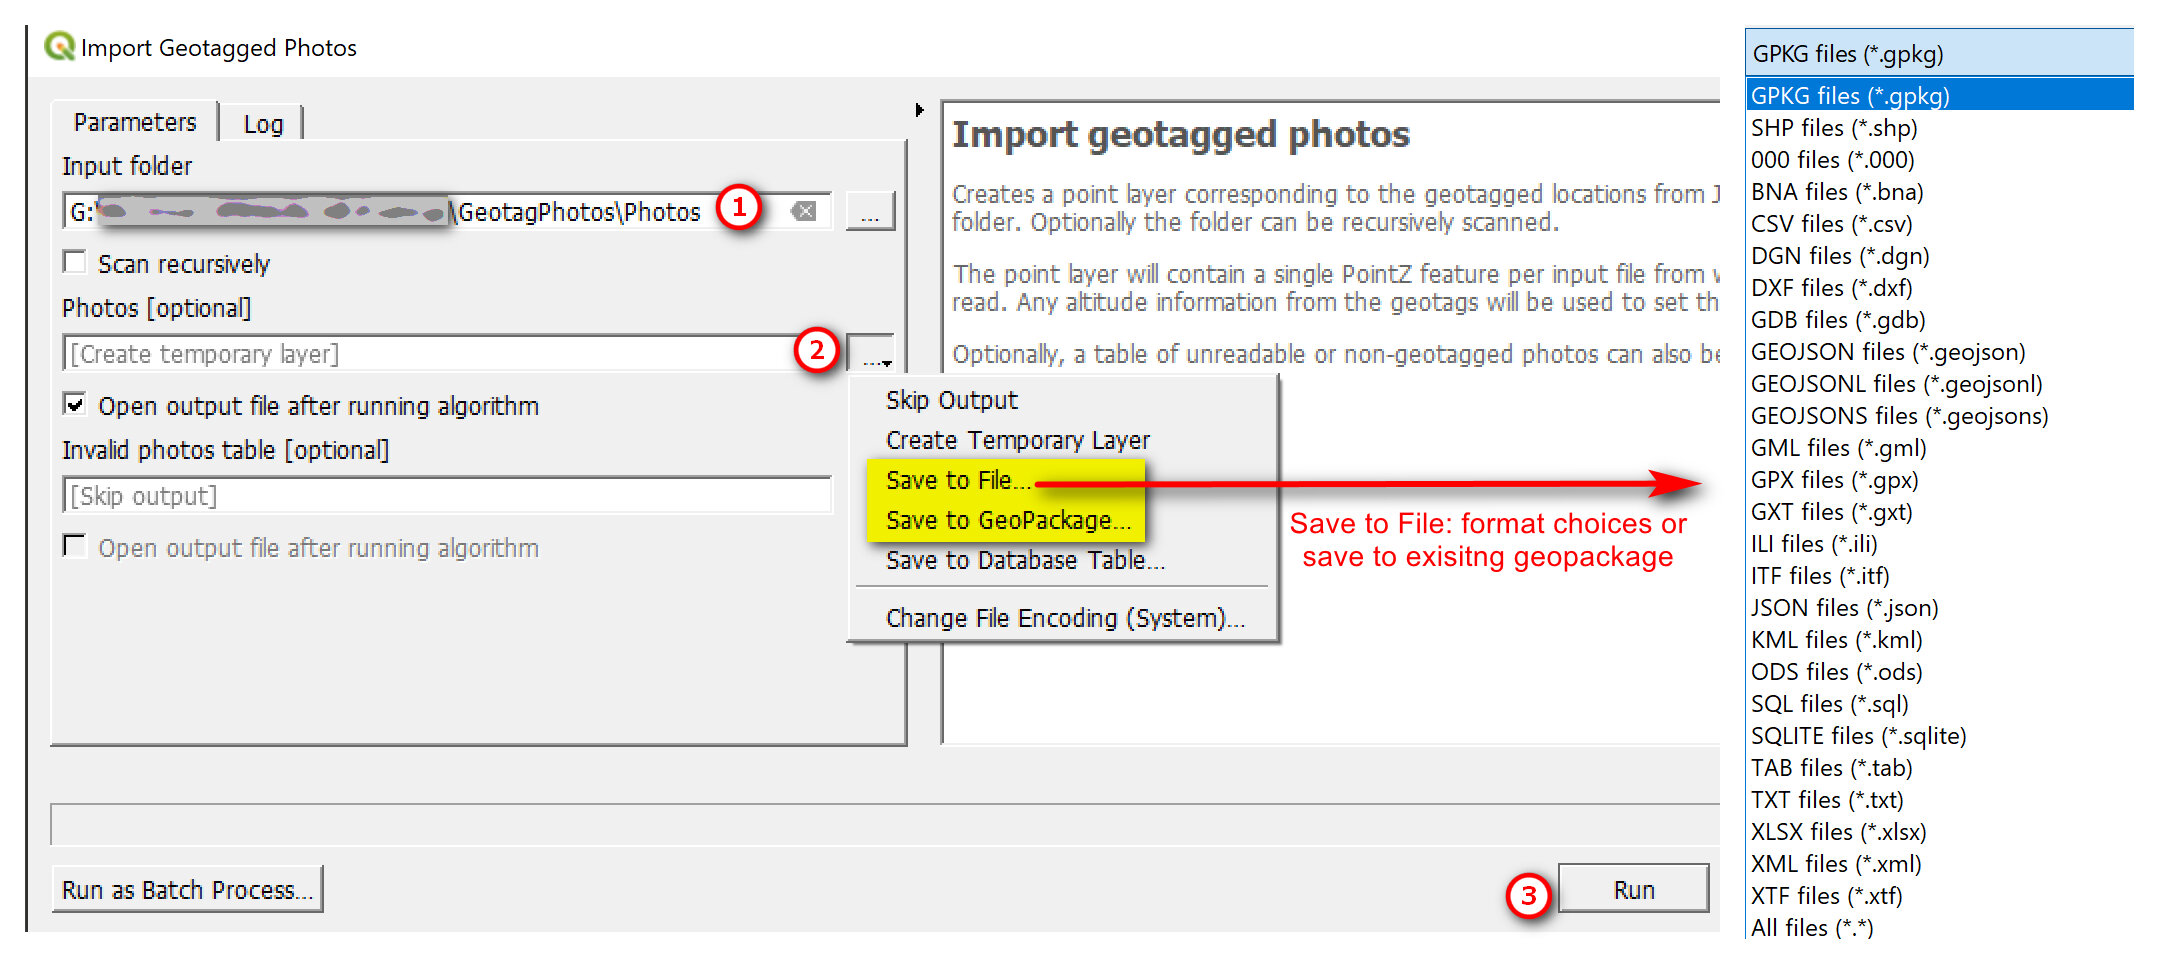
In the Import Geotagged Photos window:
Input Folder: Browse to where your photos are stored
Photos [optional]: Click the drop down arrow >> Save to File. Select a file format. In this example, I’m just saving as a SHP.
Click Run
After running the tool, you should have the point file added to your map. If you open up the attribute table of the point file, you should see something similar to the table below. Note that photo field contains the file path to the photos - you use this field below in the HTML Map Tip and to “symbolize” the points later.

Step 2: View Photos in Popup
Open the point layer properties:
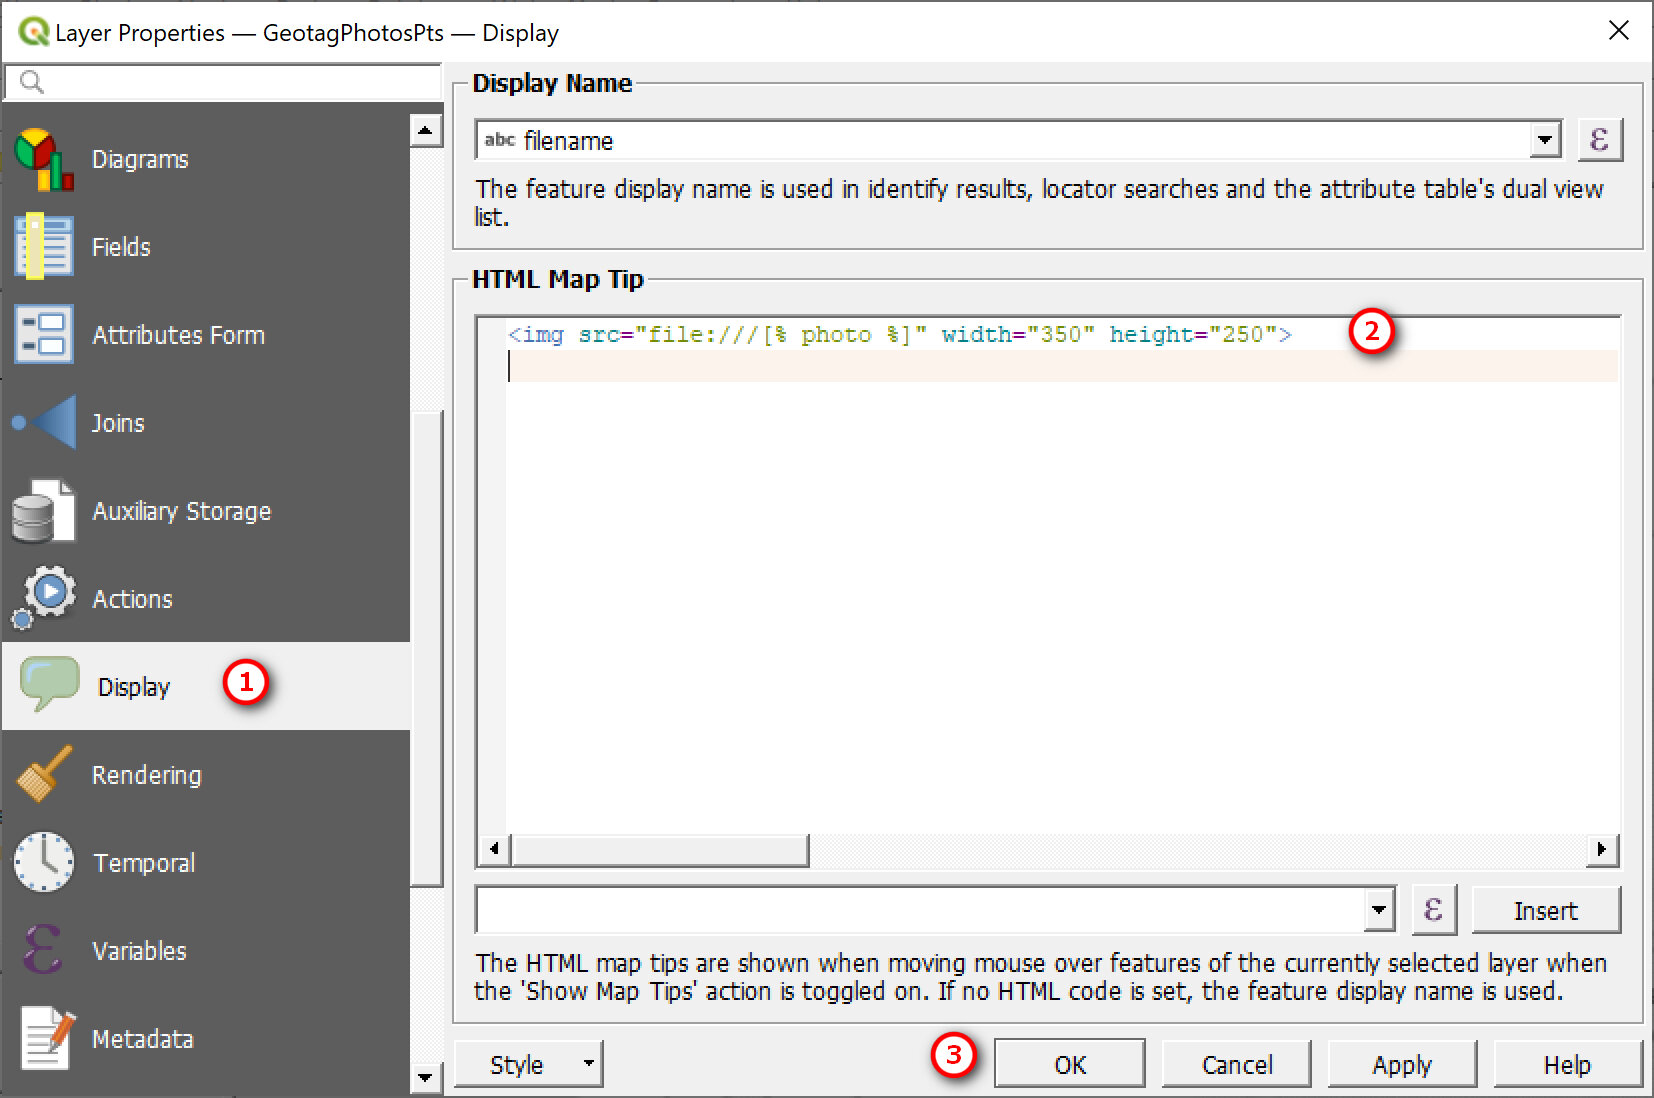
Go to the Display option.
For HTML Map Tip: you can just simple use the <img> HTML tag with the source to your photo.
Click Ok with done
Here is my example using the photo field (from attribute table). Note if file path is local - that is on your local drive then you will need to include file:/// to indicate the photo stored locally.
Simple example: <img src="file:///[% photo %]" width="350" height="250">
Another example: description is a new field I added to my attribute (see step further down)
<table>
<tr>
<th>[% descriptio %]</th>
</tr>
<tr>
<th><img src="file:///[% photo %]" width="350" height="250"></th>
</tr>
</table>
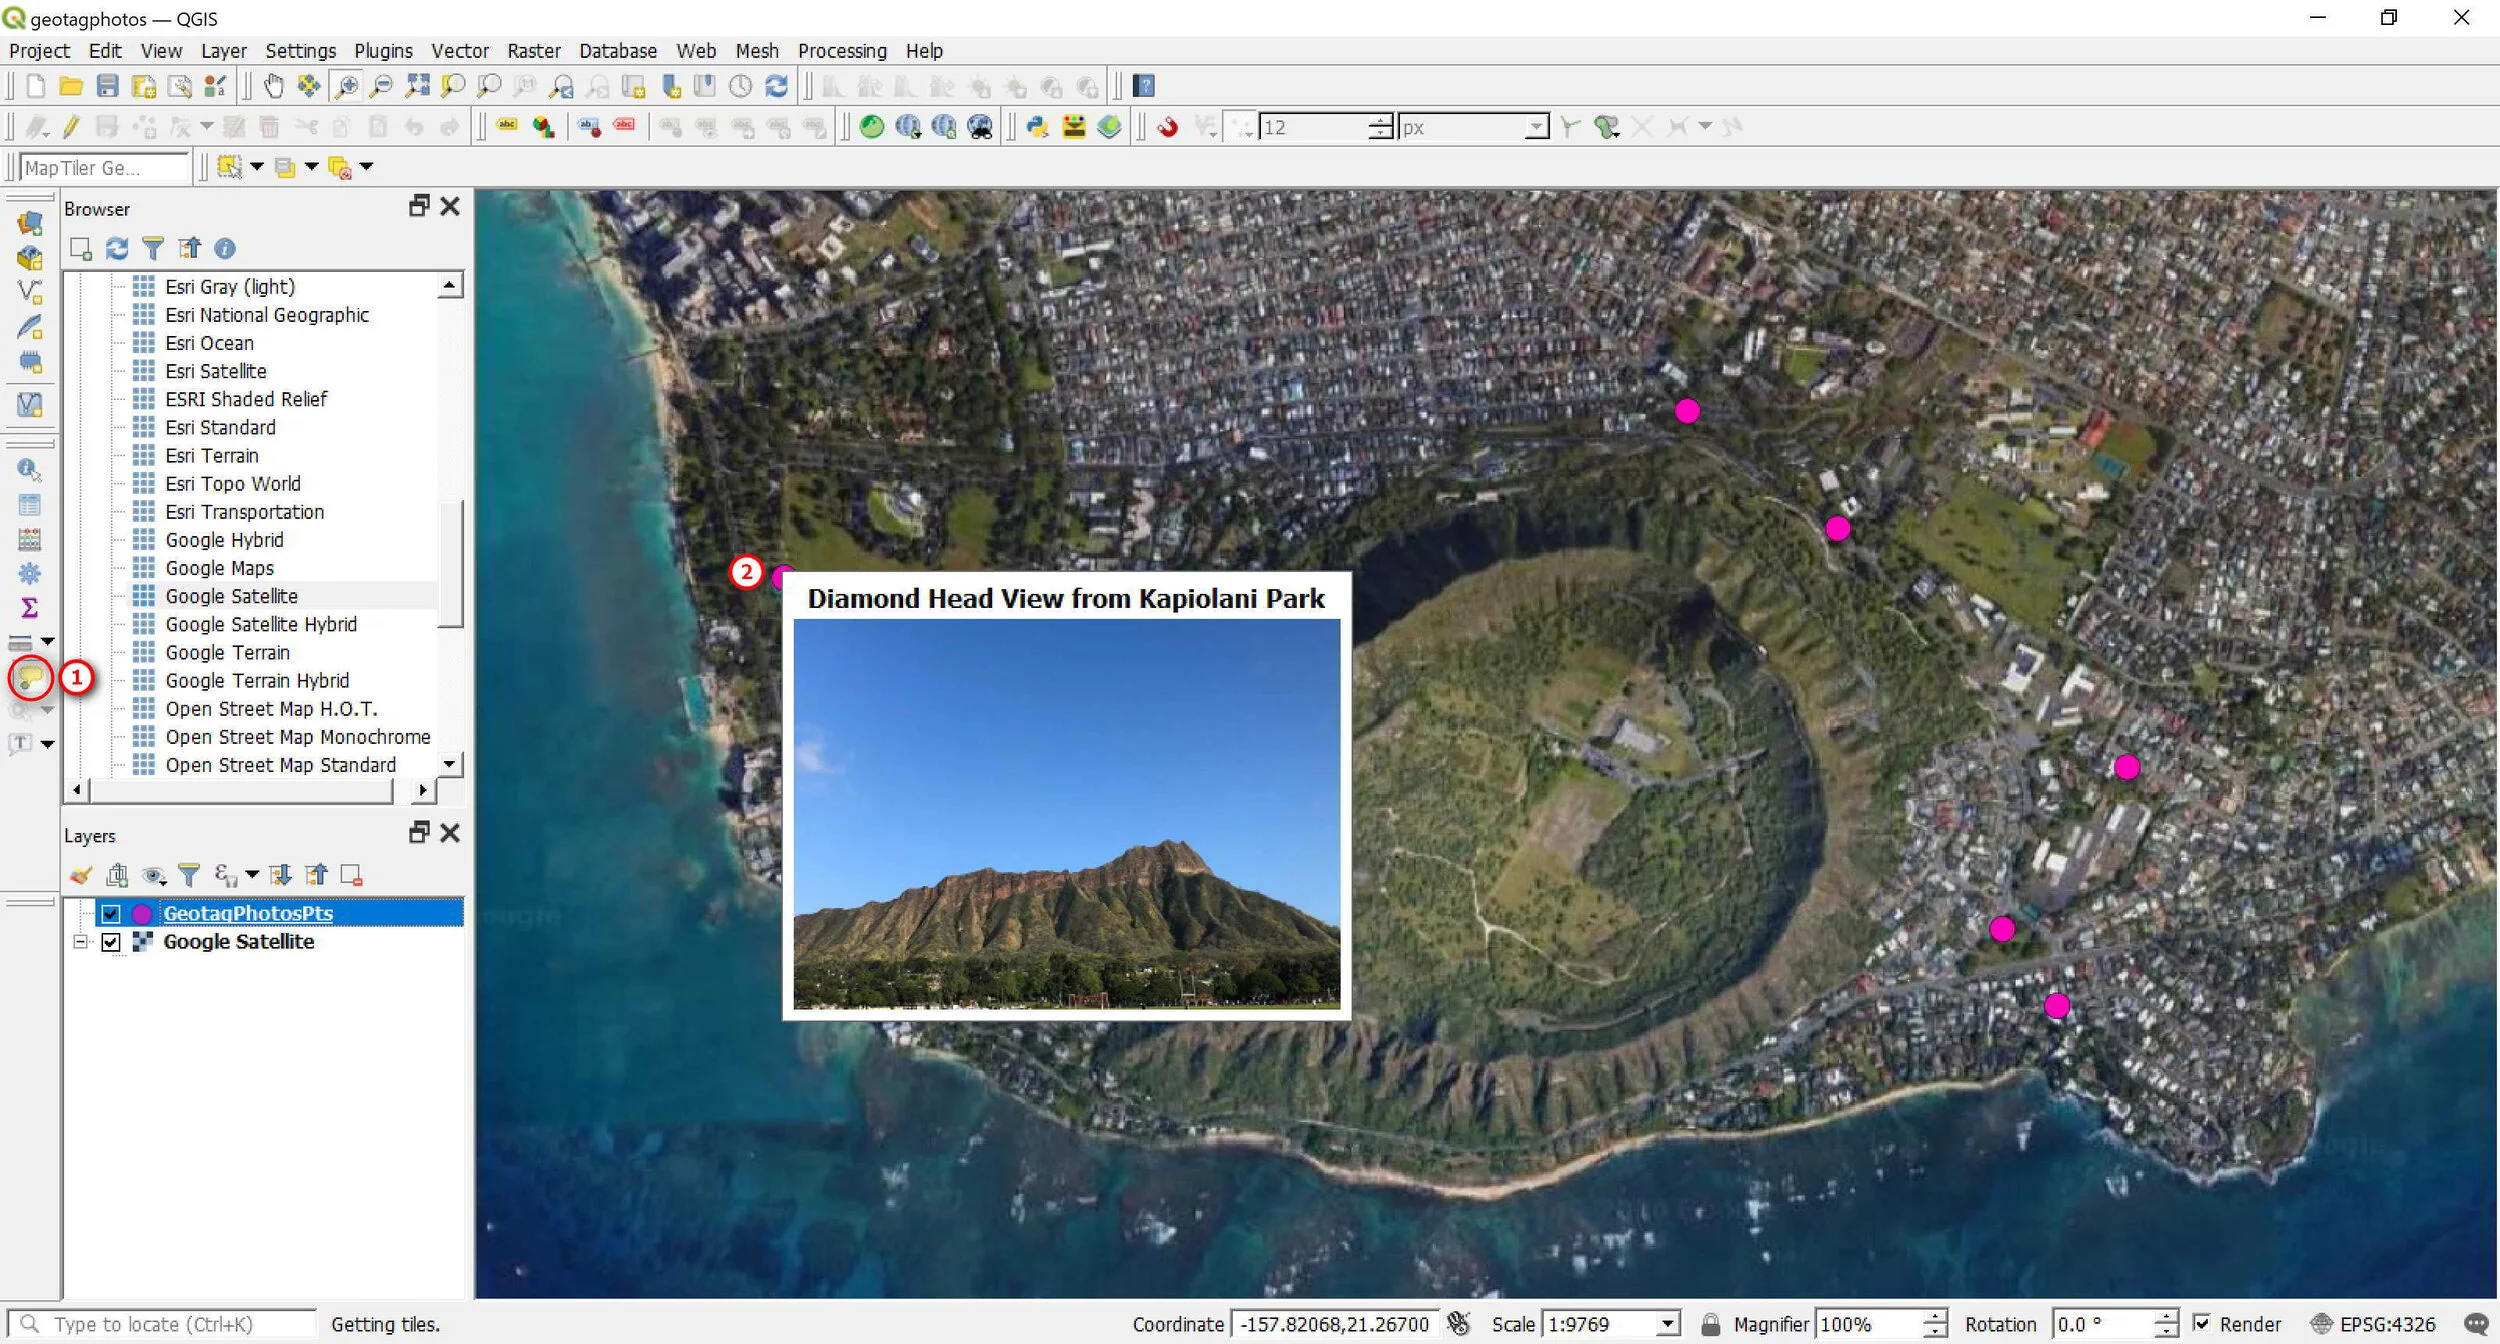
To view the photos in a popup:
Turn on or enable the Map Tip and
Hover your mouse on a point on your map to view your photo. Note my photo also include a description at the top — which you can add by editing the attribute table (see Optional Steps below)
Step 3: Show Direction Photos were Taken (OPTIONAL)
If you want to show the direction in which the photos were taken, you can do that. Just use an arrow symbol and rotation based on the Direction field (that is in your attribute table).
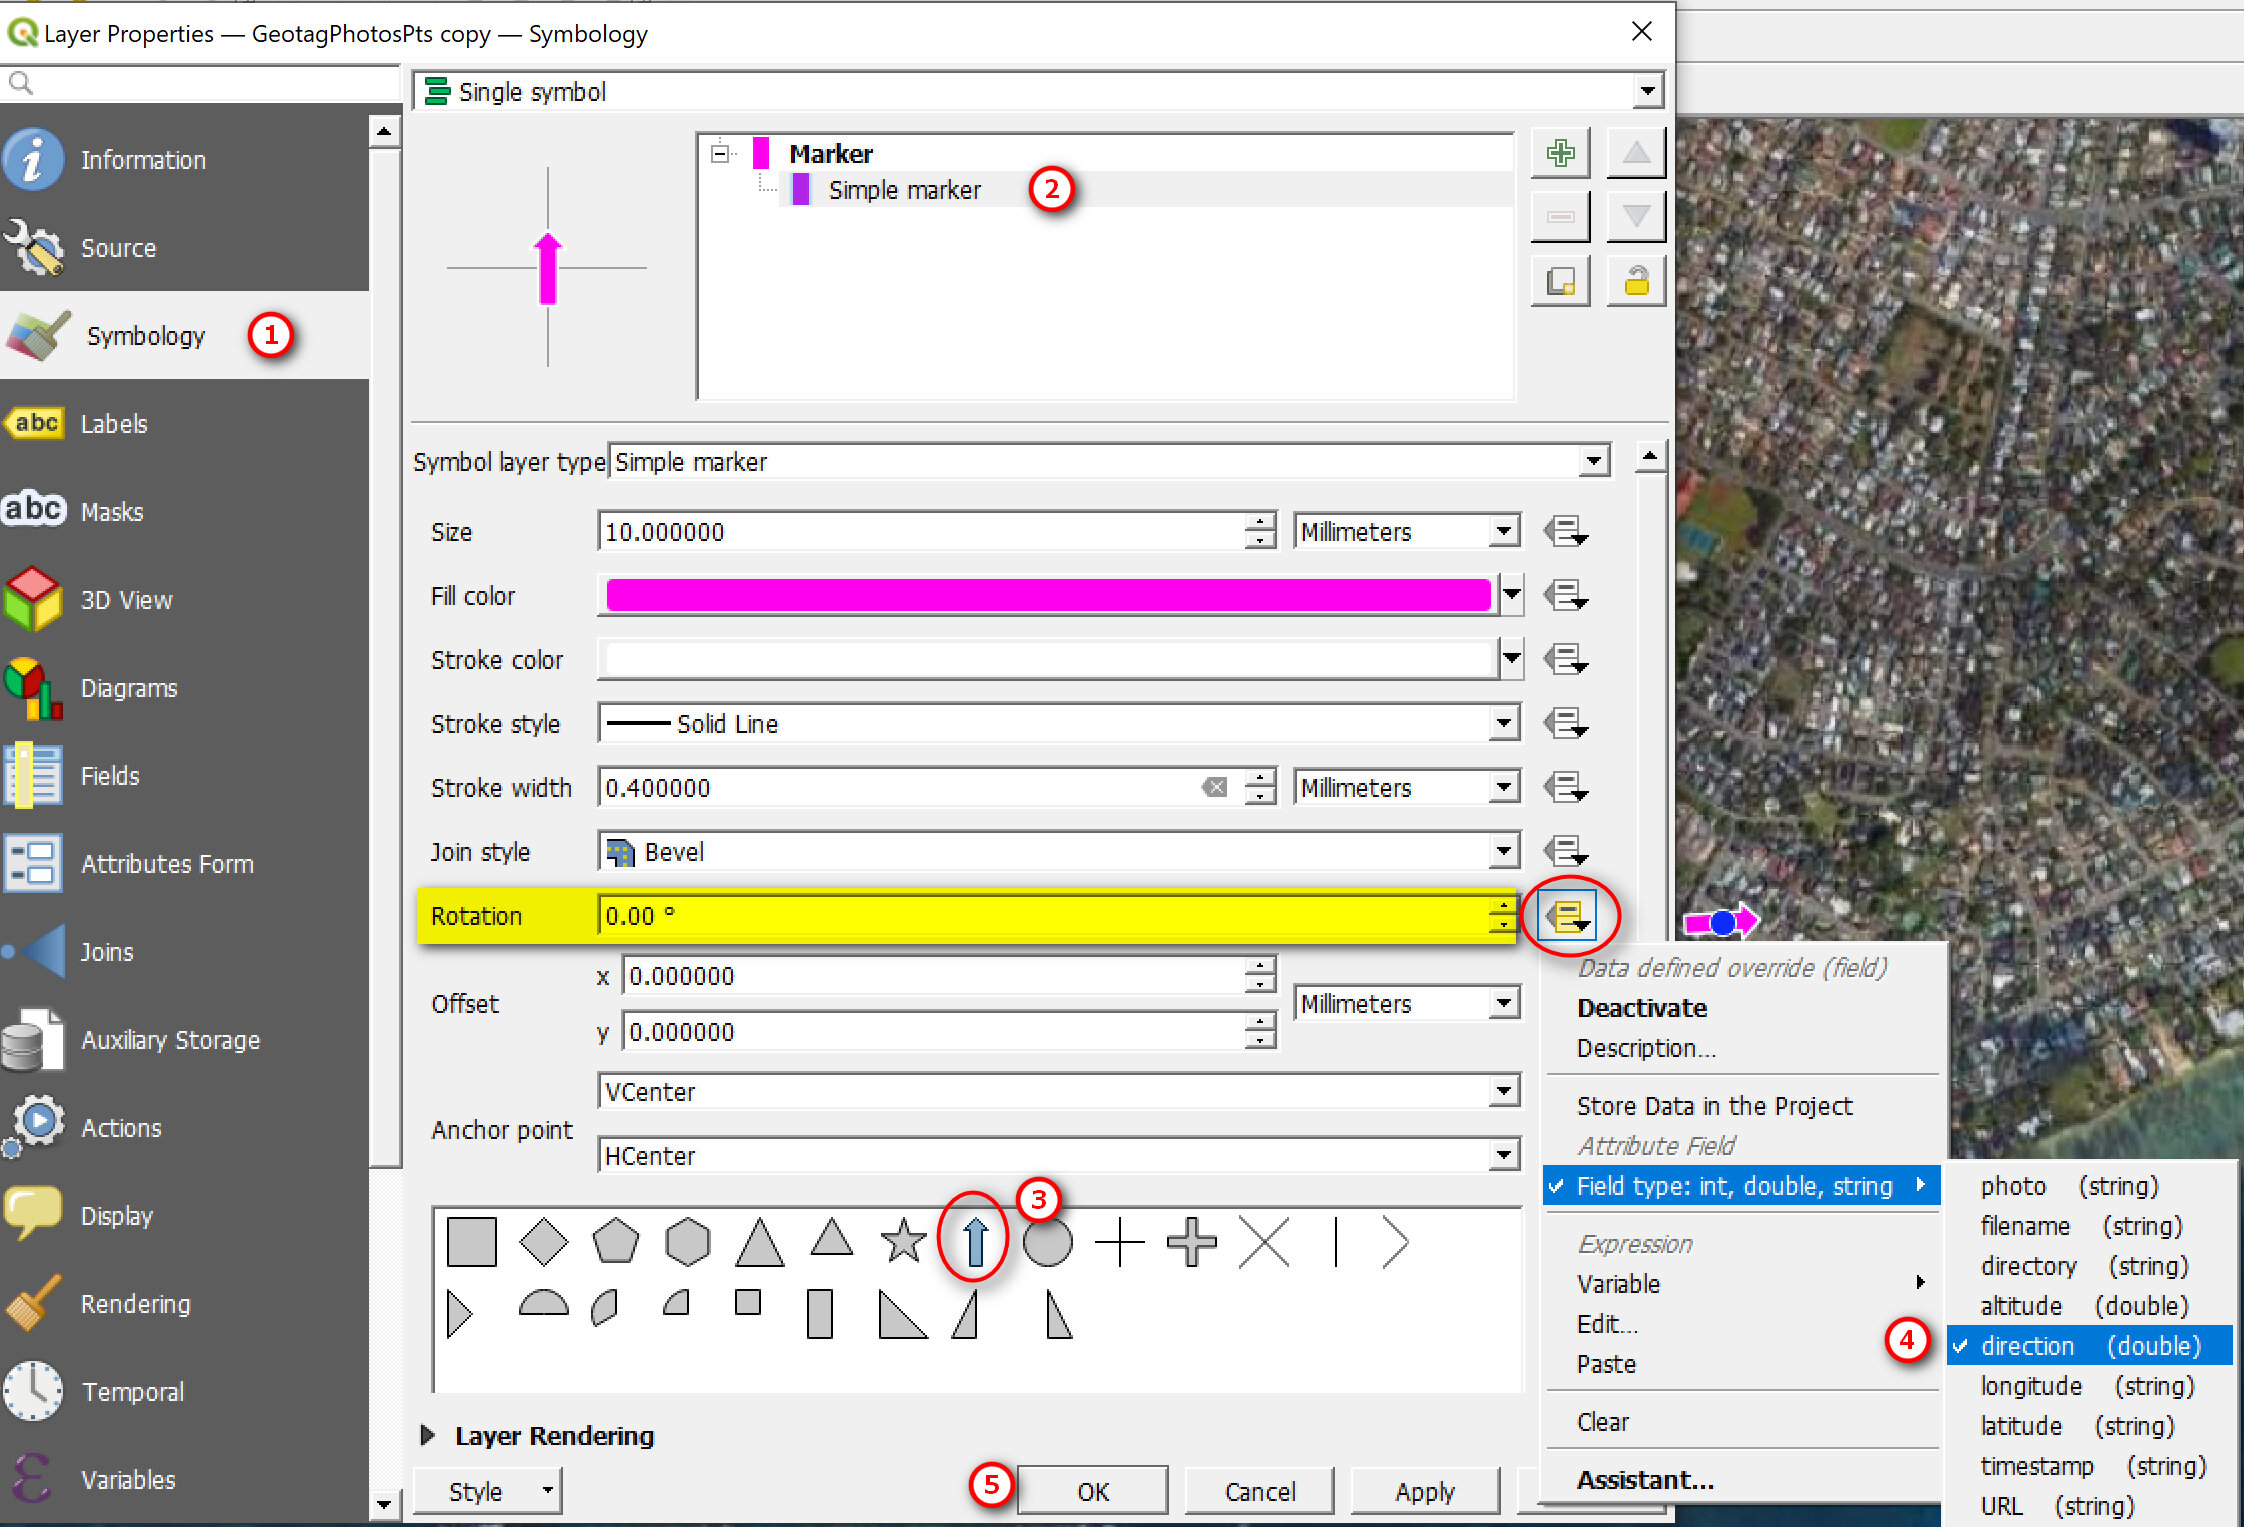
Open up the Layer Properties:
Go to Symbology
Select a Simple Marker
Select arrow symbol or whatever symbol you want
Rotation: Click the drop down arrow >> Field Type >> Direction
Click OK and you should see the arrow symbol pointing in the direction that the photo was taken
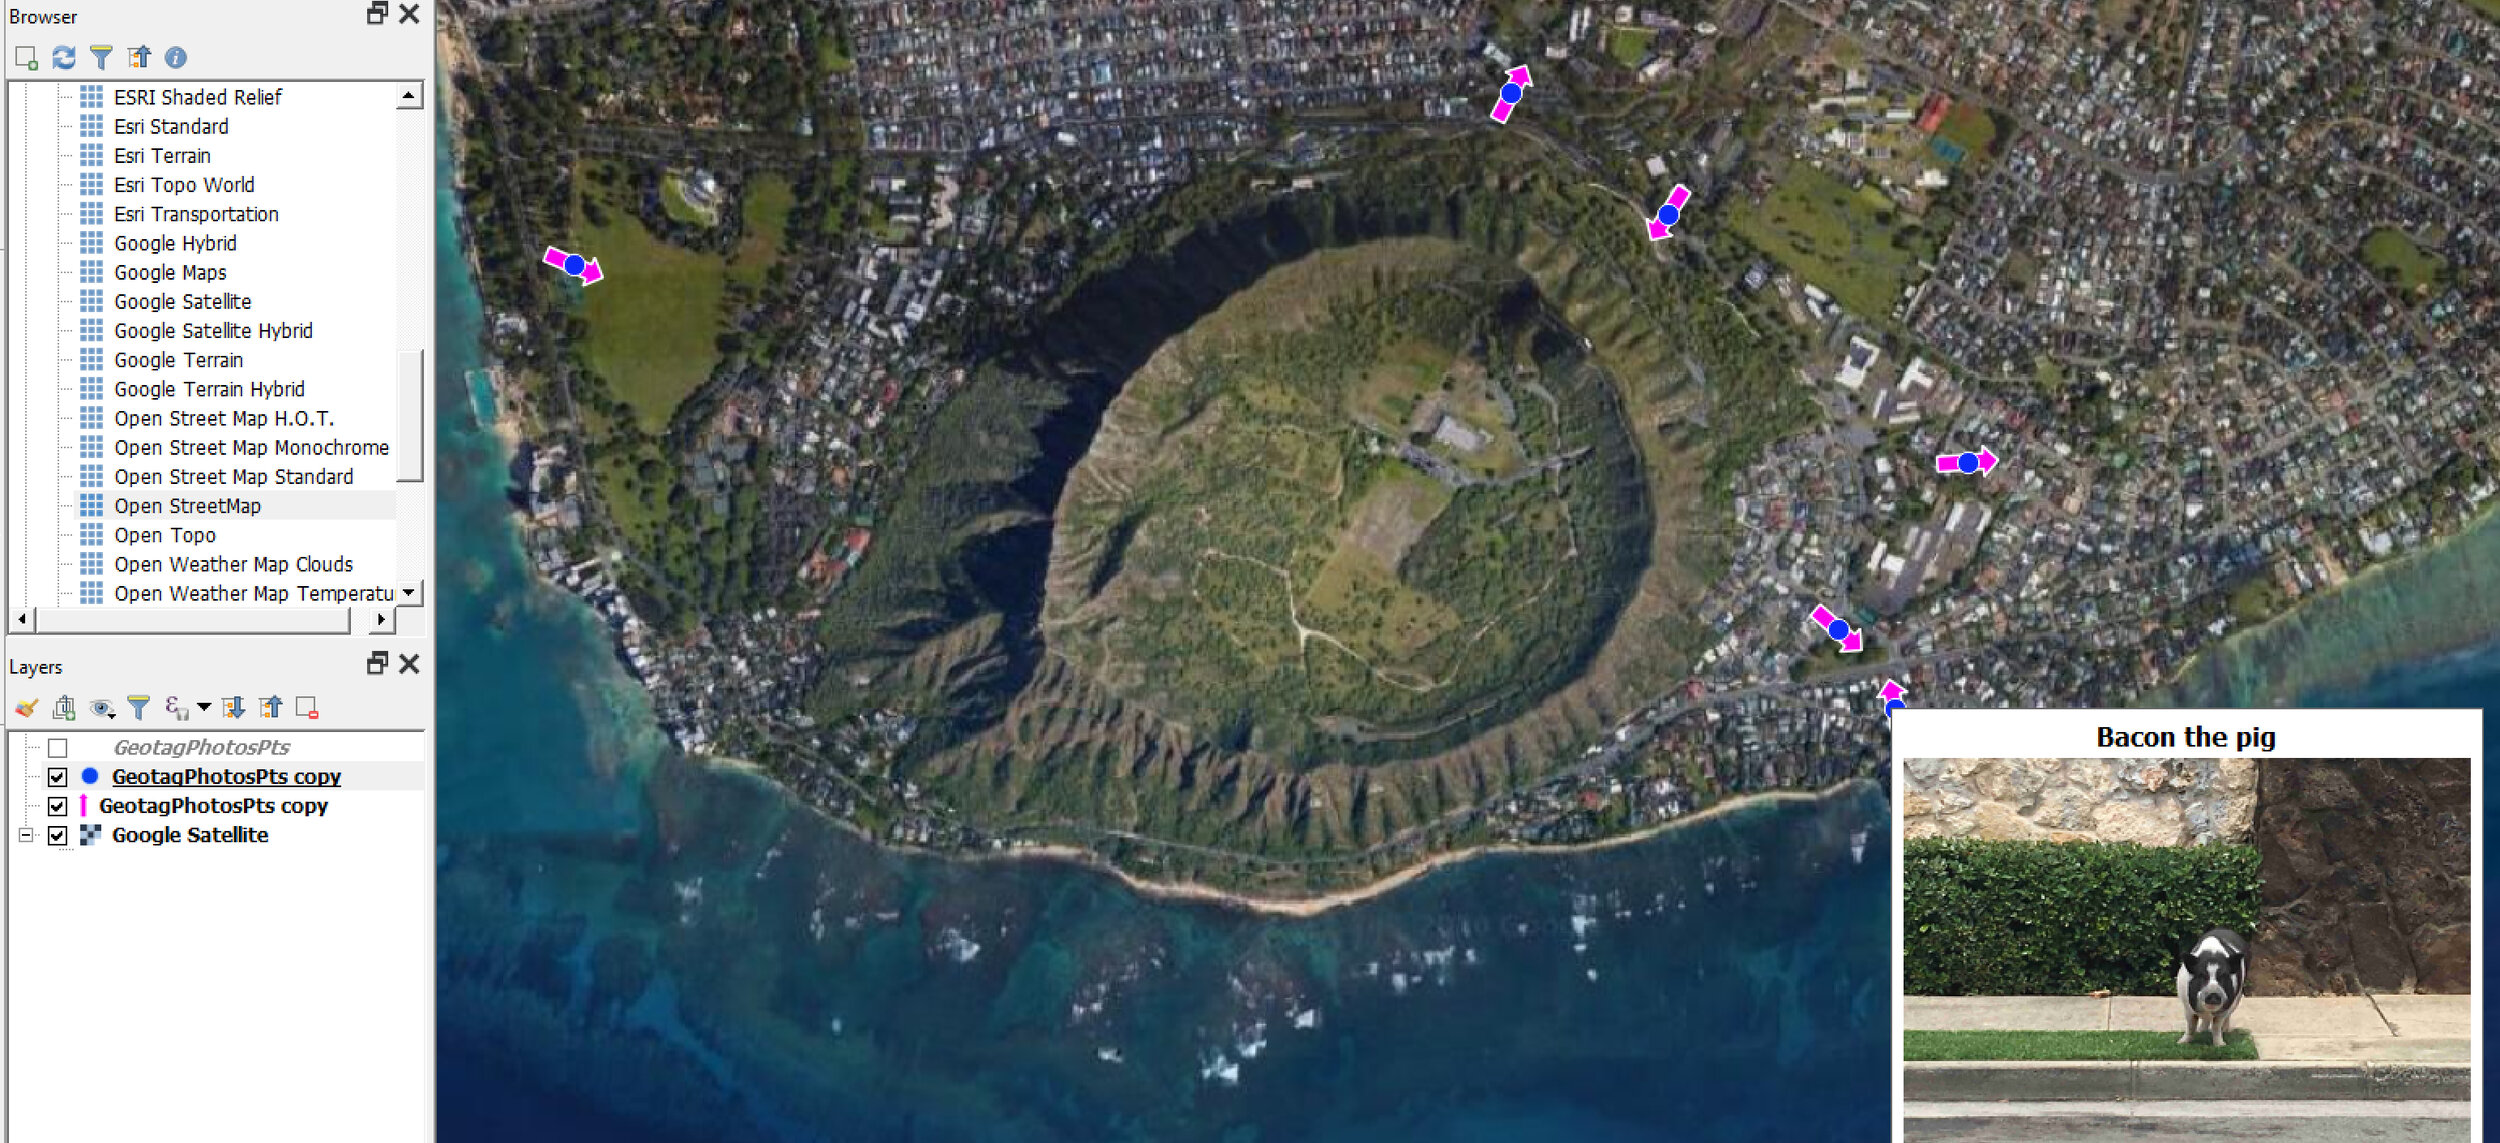
Here is my example. I just made copies of my geotagged photo point layer and showed it as points and arrow to indicate direction.
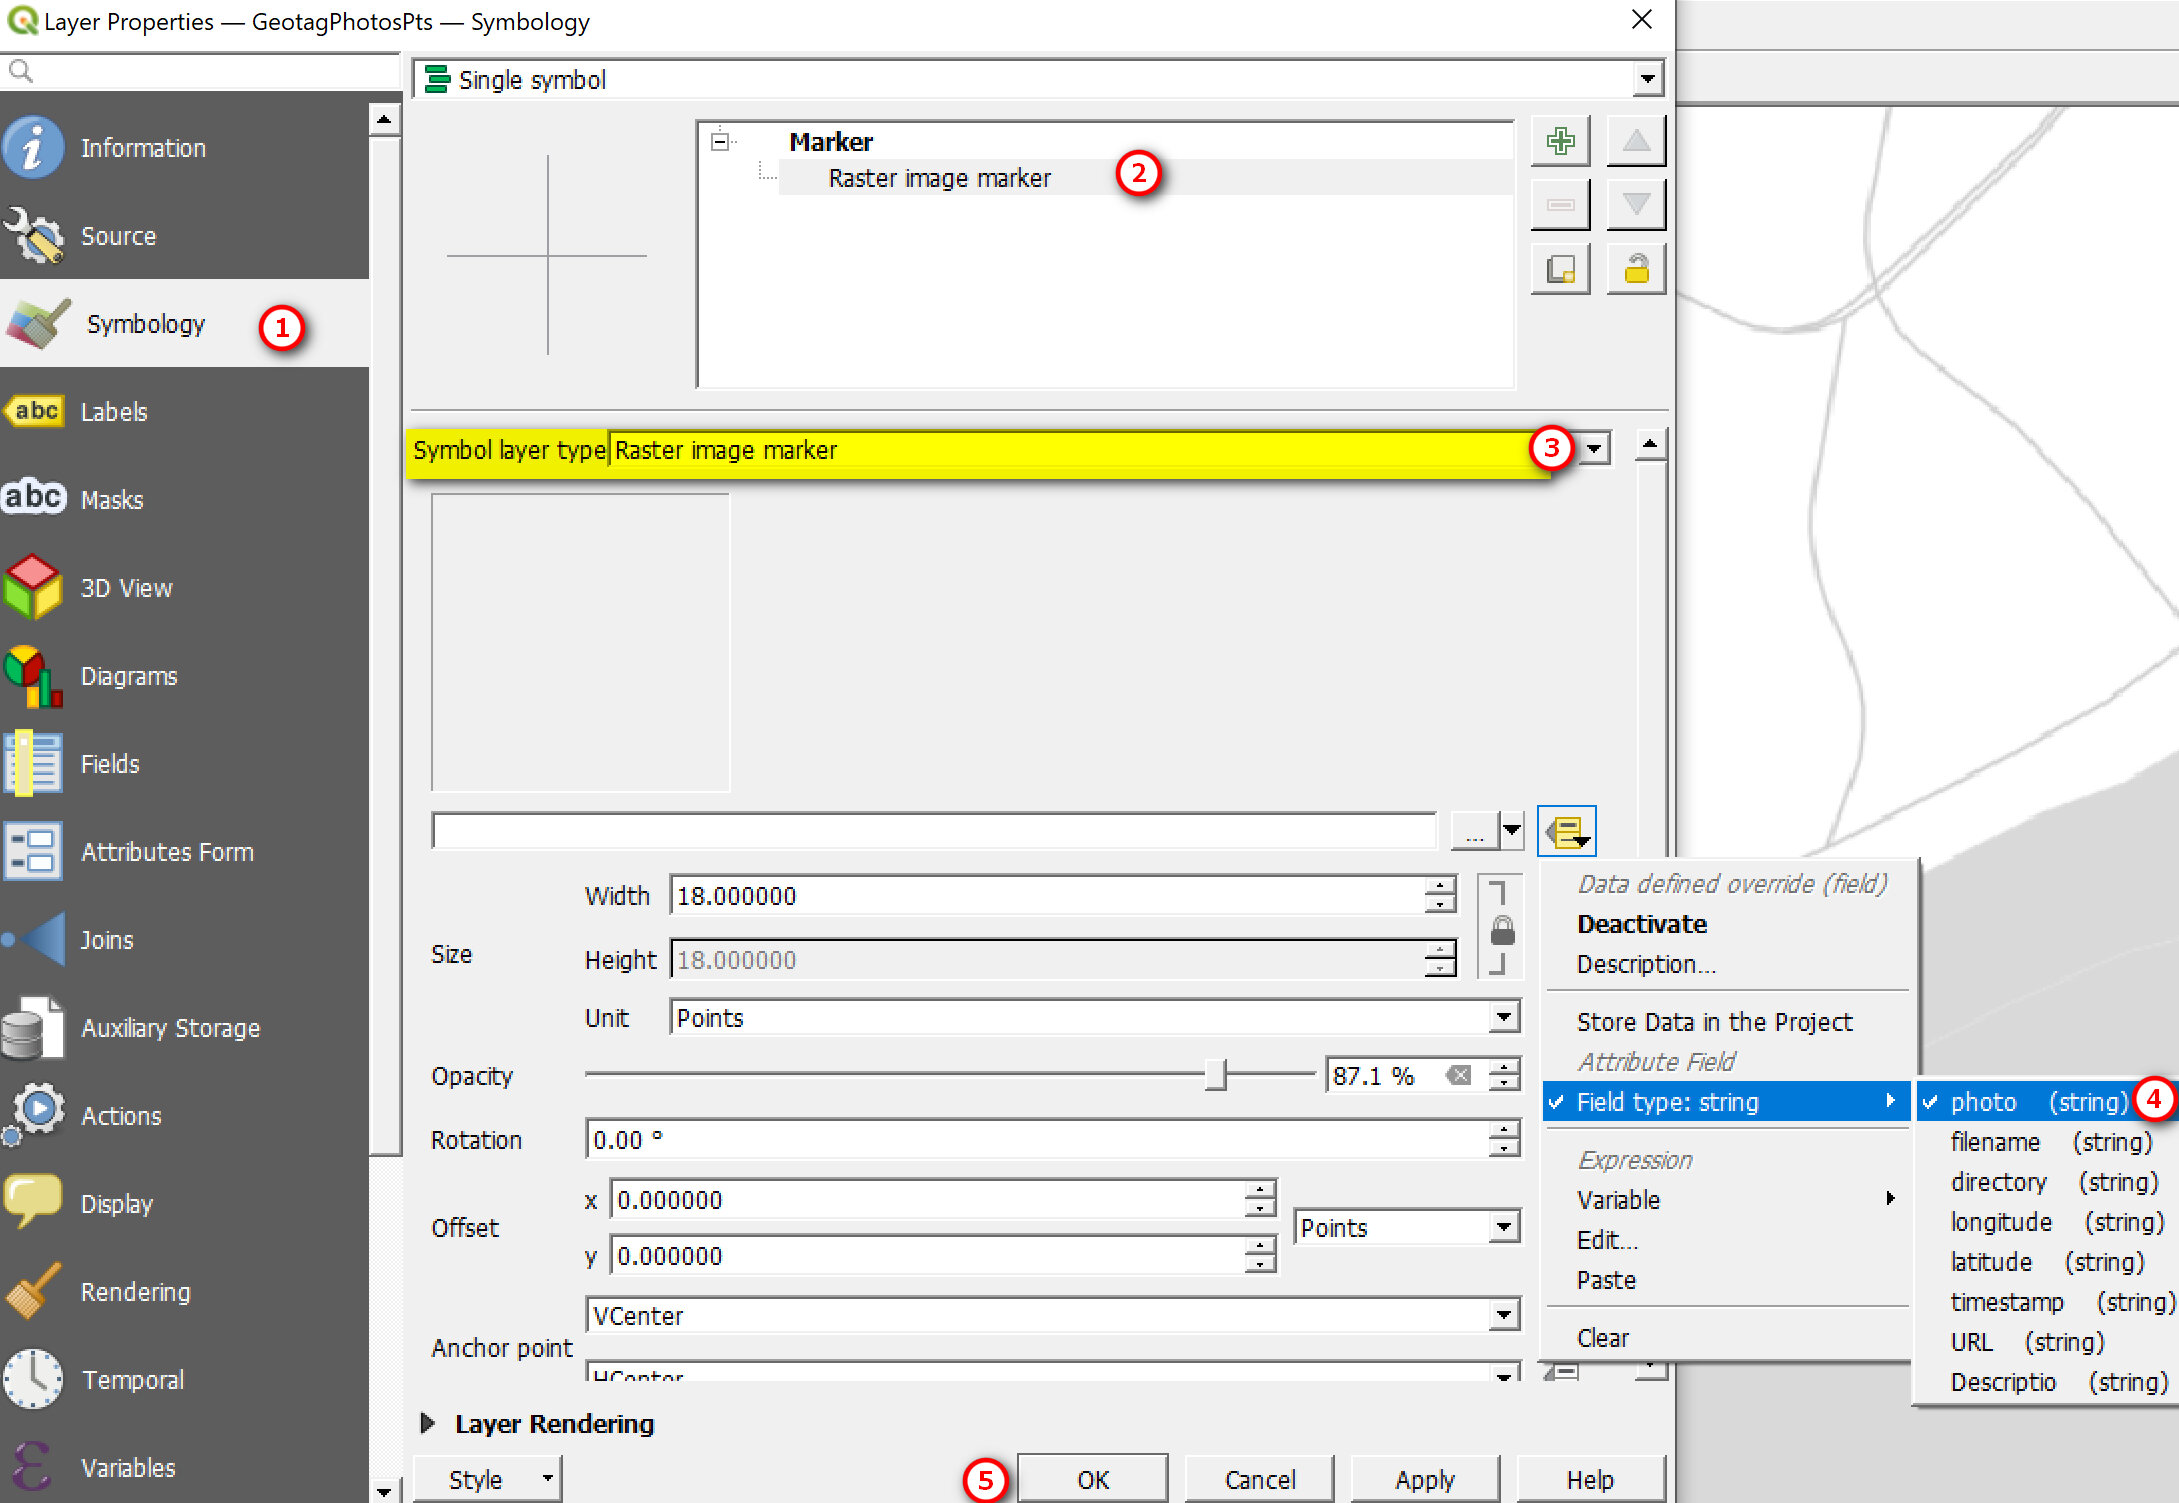
Step 3A: Symbolize Points Using the Photos (OPTIONAL)
So what if you wanted to show the point locations using the photos themselves? You can do this with the raster
Open up Layer Properties >>
Go to Symbology
Click on Simple Marker
Symbol Layer Type: click the drop down >> Raster Image Marker
Click the Data Define Override button >> Field Type >> Photo (this is field in your attribute table)
Make any other changes to the size if you want (e.g. size = 30 to make thumbnail images bigger)
Here is what my example looks like, using the photos as raster images to symbolize my point locations.

Step 4: Create Web Map with Popup (OPTIONAL)
For this portion you will need to have your photos stored on the web somewhere and be accessible using a direct link (e.g. https:///www.yourwebsite.com/filename.jpg). Also you will need the QGIS2Web Plugin installed.
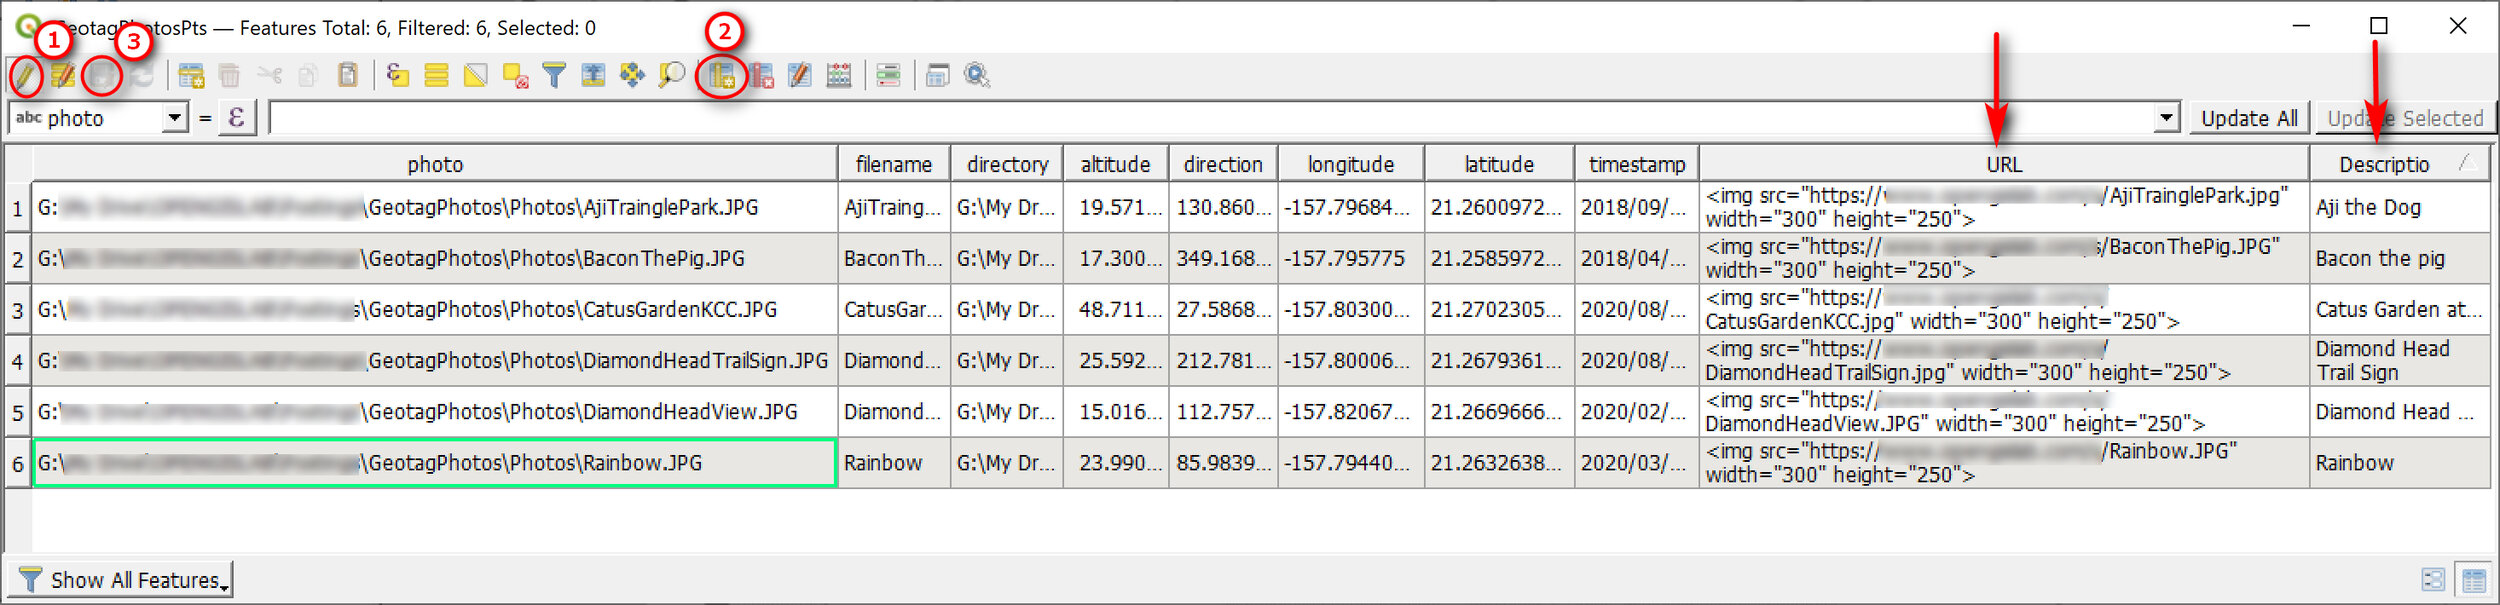
I’ve edited the attribute table of my geotagged photo layer to include a Description and URL fields that I’m going to use later for a quick web map. The URL and Description Fields are new fields that I’ve added to my table (which you won’t have in your table).
Edit Attribute Table to include photo uRL
Toggle the Edit (pencil) button
Add New Field: input field name (e.g. URL) and field type (text or string) and length (e.g. 100). I’ve also added a description field to describe my photo.
e.g. <img src="https://www.opengislab.com/s/DiamondHeadView.JPG" width="350" height="250">
Note: I chose to use the full <img> html tag in my URL (with widget type = text edit) as it’s easier to specify the width and height. The QGIS2Web plugin seems to only show the full photo size, which isn’t what I want. I’ve seen others use the photo field or a URL without <img> tag with widget type = Attachment and Integrated Document Viewer option as either Image or Web View with width and height set to either auto or actual values — Using these options doesn’t work for me and doesn’t produce the result I want.
When done editing table, save it
Don’t forget to toggle off the Edit
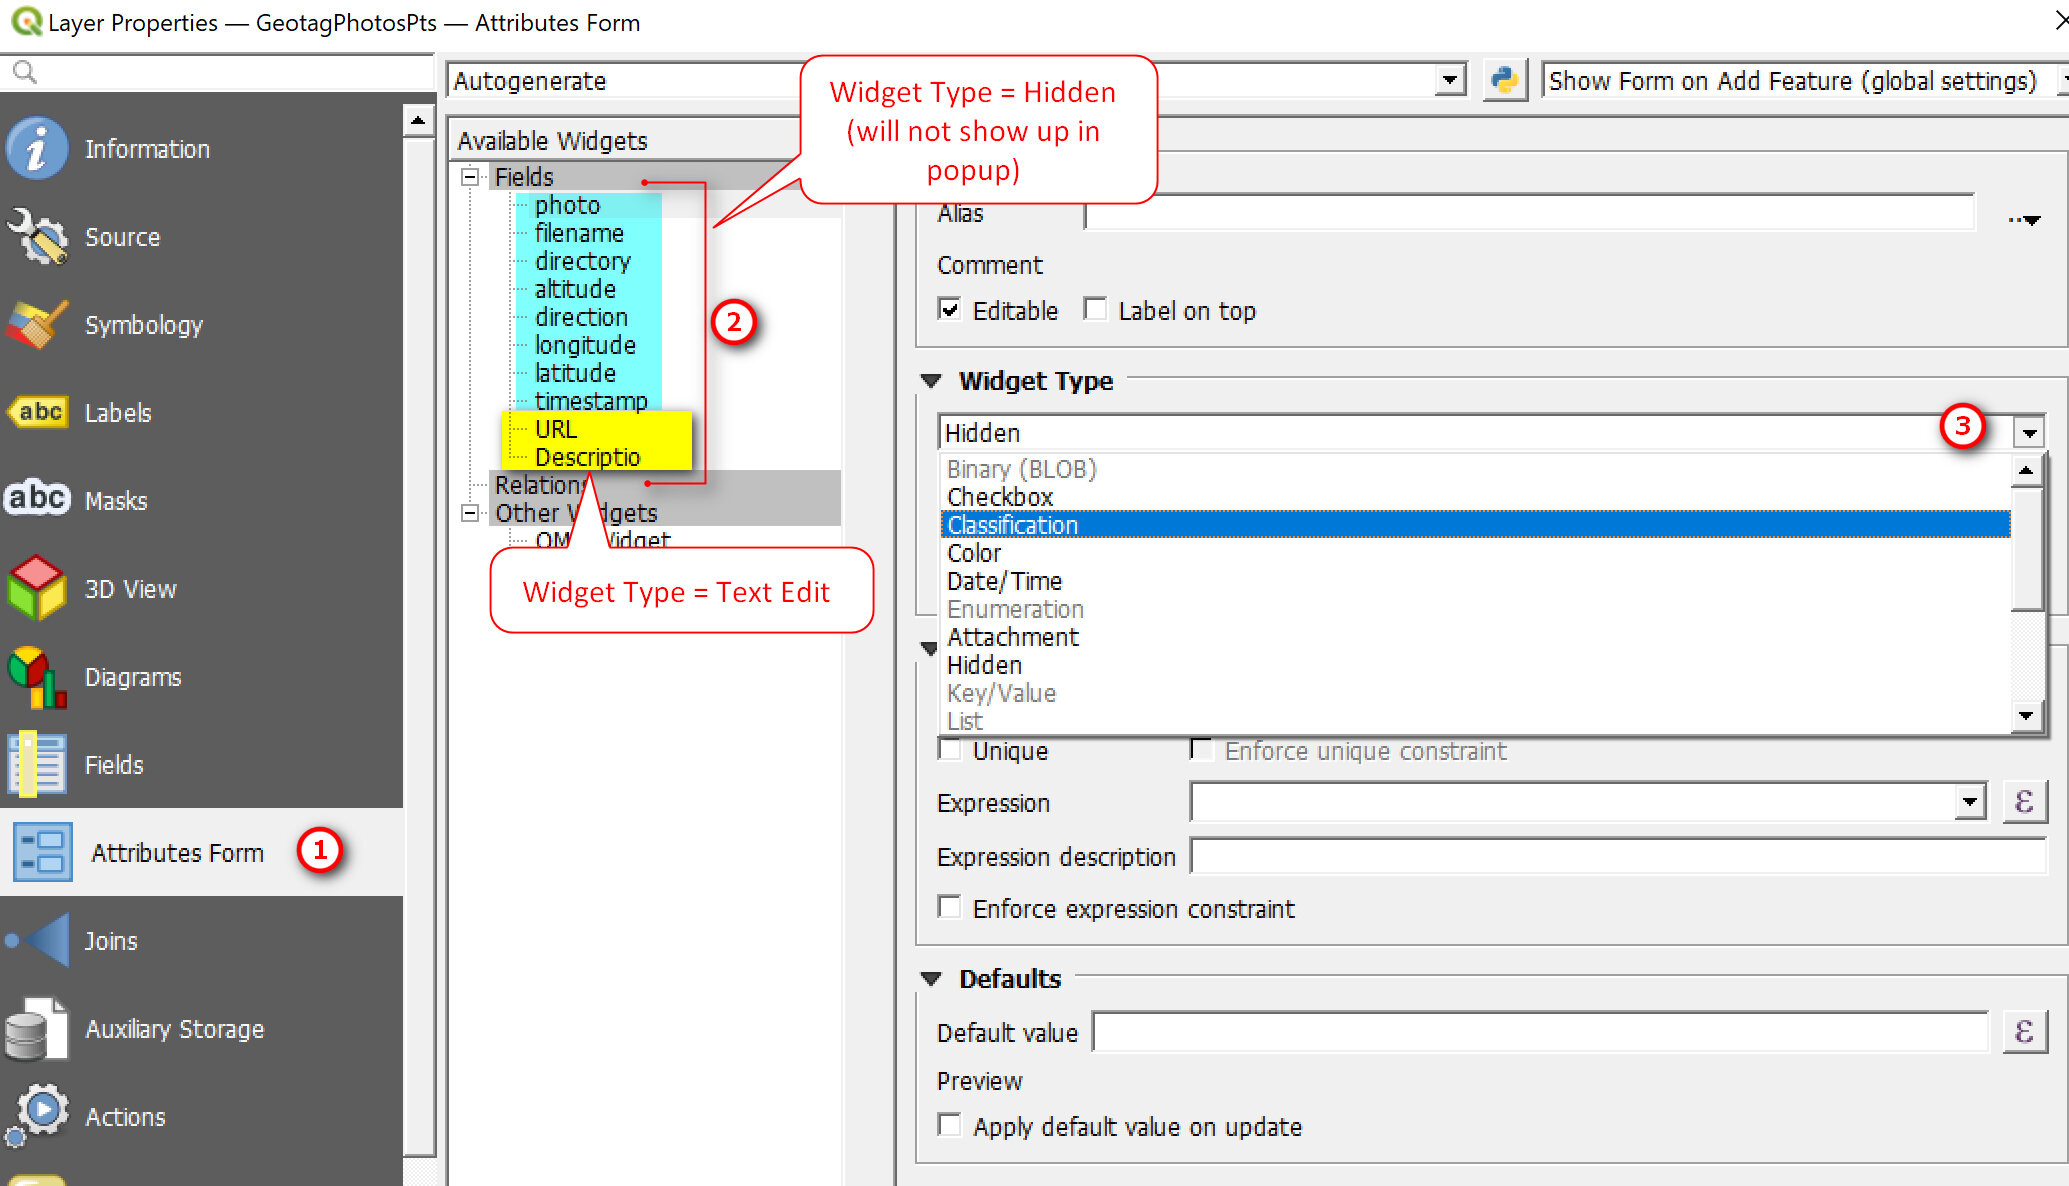
Hide Unwanted Fields in Popup
Lets say for my web map popup I only want to show the photos (i.e. URL field) and Description only. You can do this by hiding all the other fields you don’t want to display.
Open Layer Properties:
Go to Attributes Form
Click on a field (e.g .photo)
Widget Type: Click drop down arrow >> Hidden
Make sure URL field and Description both have Widget Type = Text Edit
Click OK when done
Create Web Map Using QGIS2 Web Plugin
You must aleady have the qgis2web plugin installed to do this portion.
Go to Web Menu >> qgis2web >> Create Web Map

In the Export to Web Map window:
Make sure your Geotagged Photo points are visible and popups are turned on. Noticed that only the URL and Description fields are visible. Also make sure you have a basemap (e.g. Stamen Toner Light). View the other tab options and make any changes you want.
Select Leaflet (seems to be option that works best)
Click Update Preview button to preview your map
Click Export if preview looks good

The Export tab has an option to Export to Folder or to an FTP site. The qgis2web plugin with export web files which you can put on a web server.

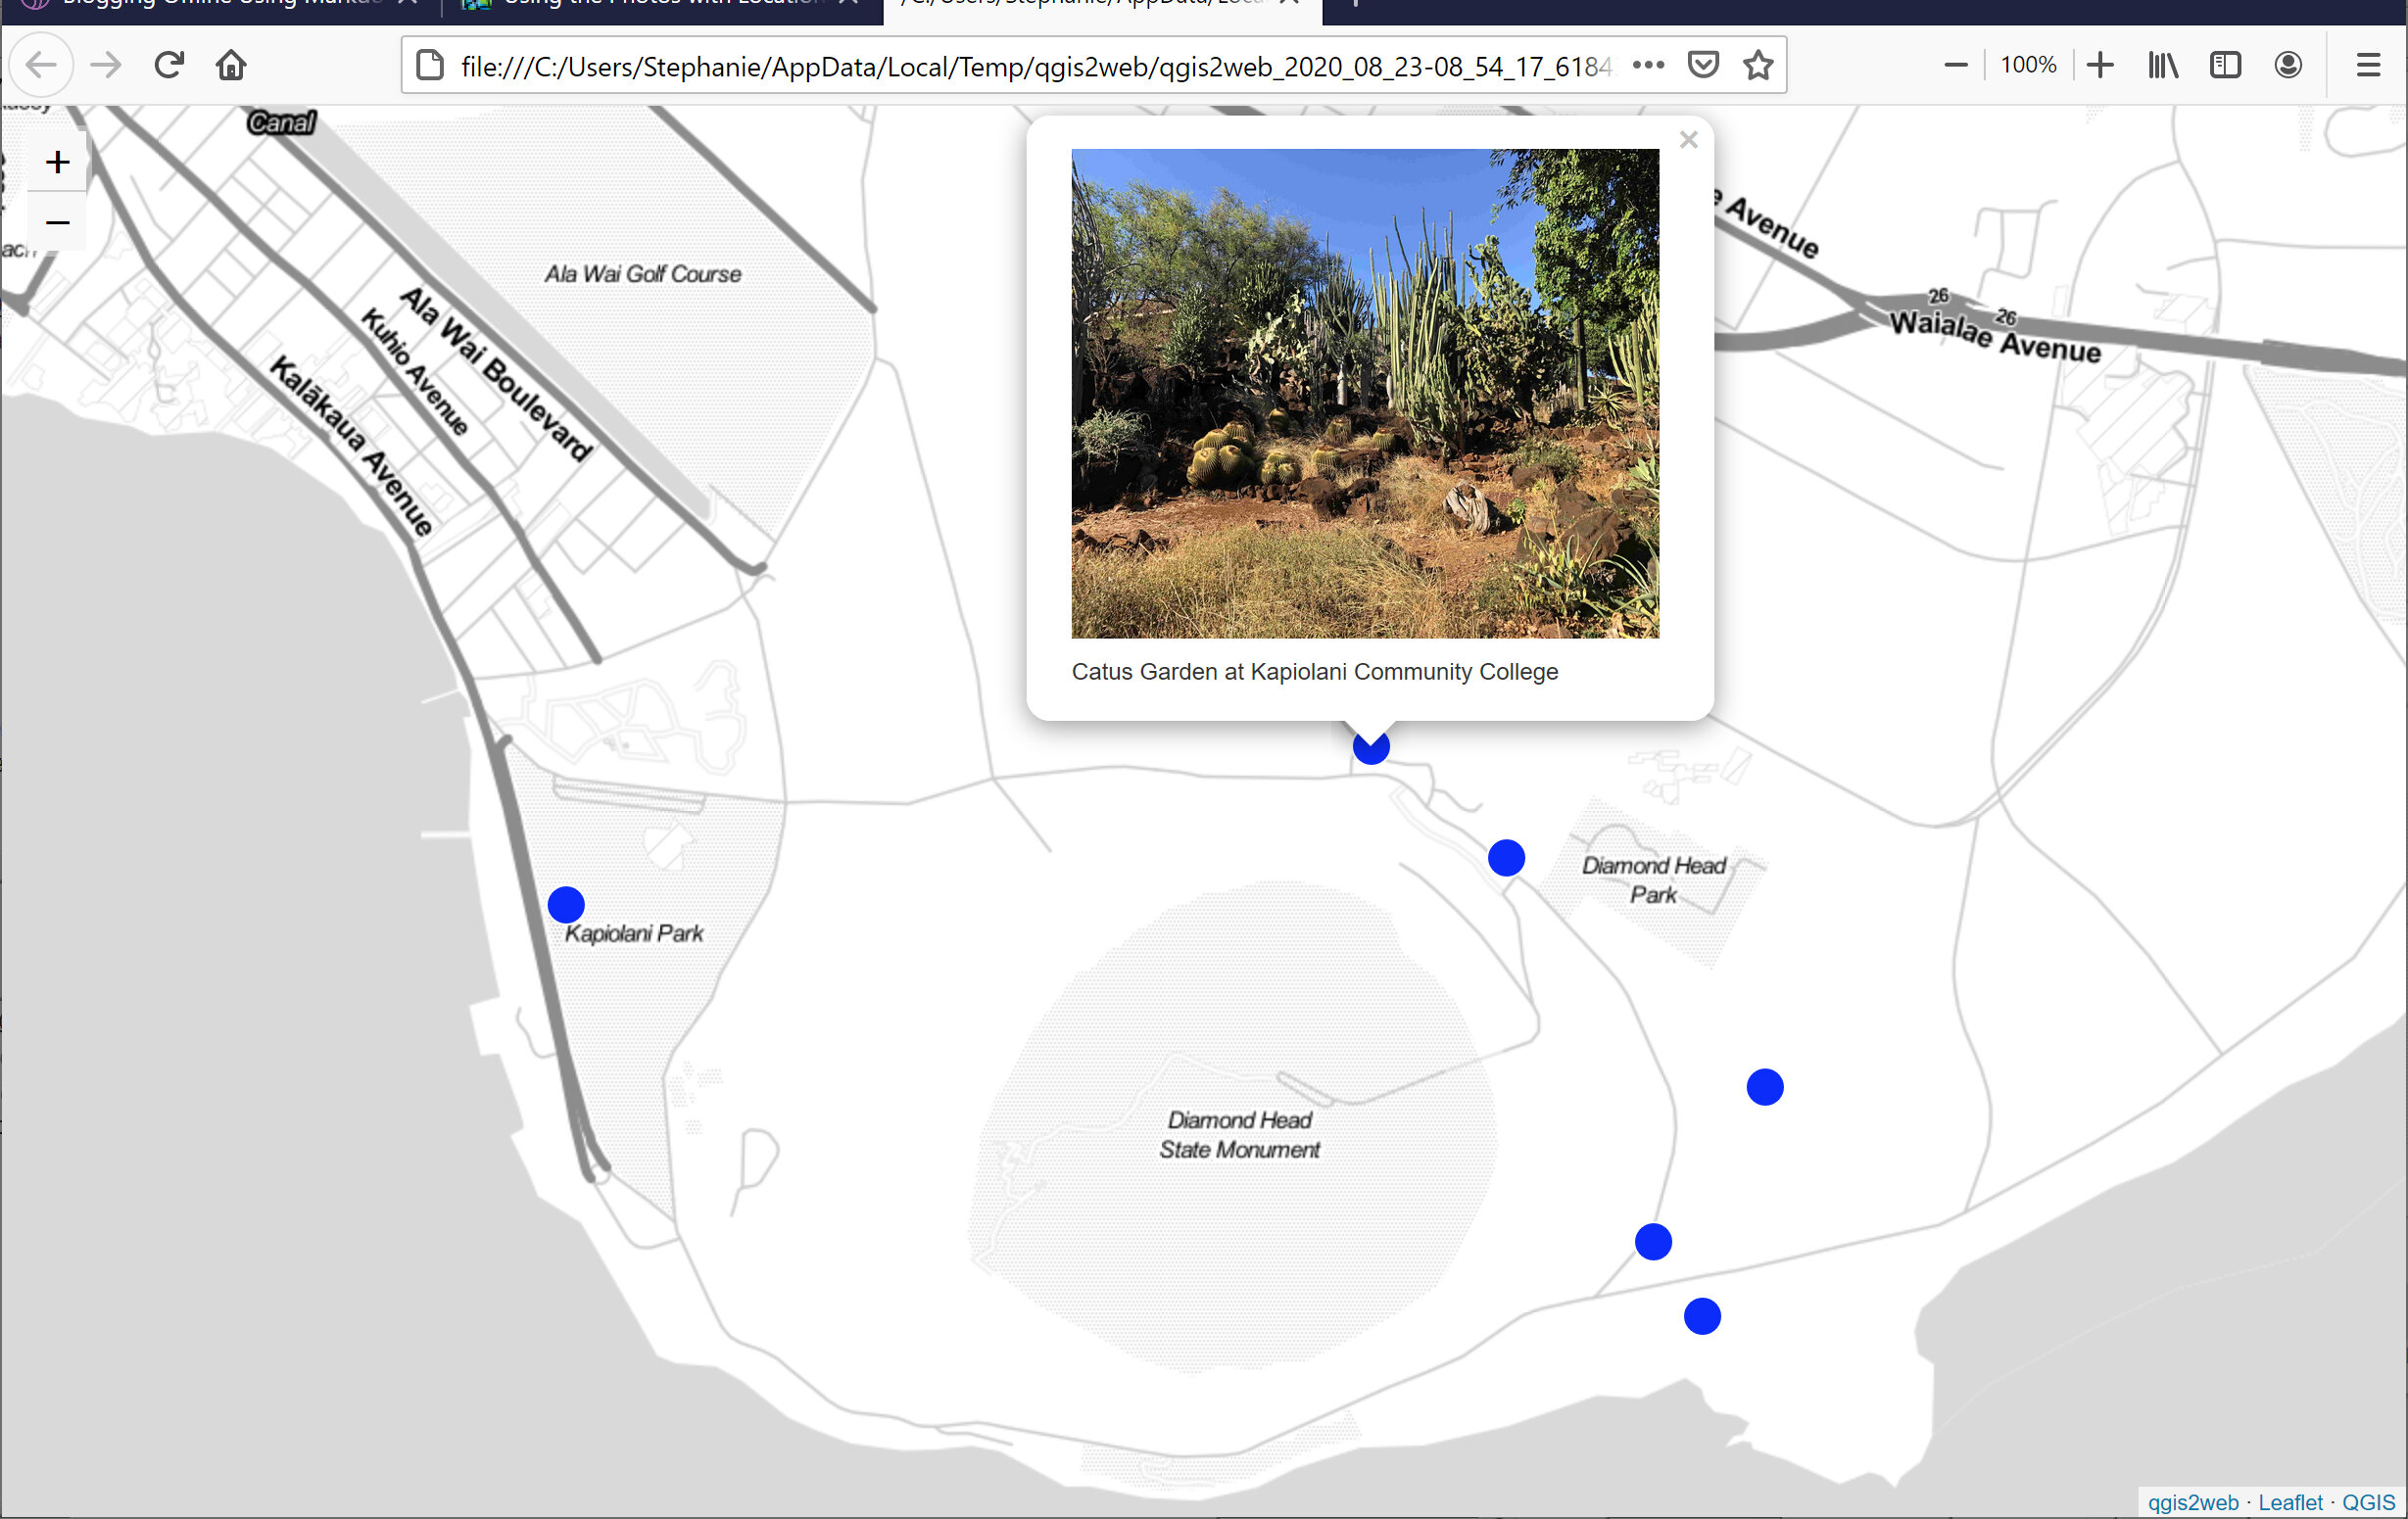
The exported Leaflet web map (shown locally)
That’s it for this post on mapping and viewing geotagged photos in QGIS. I hope you find it useful, and thanks for reading as always. Until next time :).