Exploring MapStore as an Opensource Web Mapping Framework

For the past weeks I have been exploring MapStore as a web mapping framework. MapStore is developed by GeoSolutions and is opensource so you can use it freely and modify as you wish. “MapStore is based on OpenLayers, Leaflet and ReactJS, and is licensed under the Simplified BSD license.”

I think MapStore has the potential to be a great alternative to ESRI for those looking for an opensource solution. Mapstore has 3 components (Web Maps, Dashboards, and Story maps) in a single framework. I'm thinking a setup with GeoServer/PosgreSQL/PostGIS combo (GIS server serving as data catalog), Apache/Tomcat (Webserver) plus Mapstore (front end web app) along with QIGS (desktop GIS) would make a decent opensource web GIS stack.

As far as I understand, the components of MapStore are modular (via plugins) and can be fully customized to users needs. If you are a developer then you can fully make this your own. If not, you can still use it by just making some configuration changes (with perhaps some help from your IT team to install with your own GeoServer setup). Or you can hire a developer or why not hire GeoSolutions, the developer of Mapstore - they provide commercial support for MapStore and GeoServer and will help you set up everything (I am not associated with GeoSolutions in anyway. I just like the work they're doing in the opensource realm).

Note, I am only exploring MapStore mainly as a user who want some easy configuration. This posting is my take on things, from set up on my local machine and changing some configuration settings.

Installation of MapStore

The installation process was easy enough. Instructions can be found on the Quick Start manual, so I won’t repeat it. On the MapStore documentation page are separate well documented User Guide and a Developer Guide. MapStore can be installed on a Windows or Linux system via the binary package or war package route. The easiest is to download and install via the binary package - this provides a contained sandbox with examples ready to be explored. I went the war installation route with Tomcat on my Windows system.

Configuring the MapStore User Interface

This is the default user interface of MapStore2. Obviously, I want to customize the look of this.

Mapstore defaut GUI

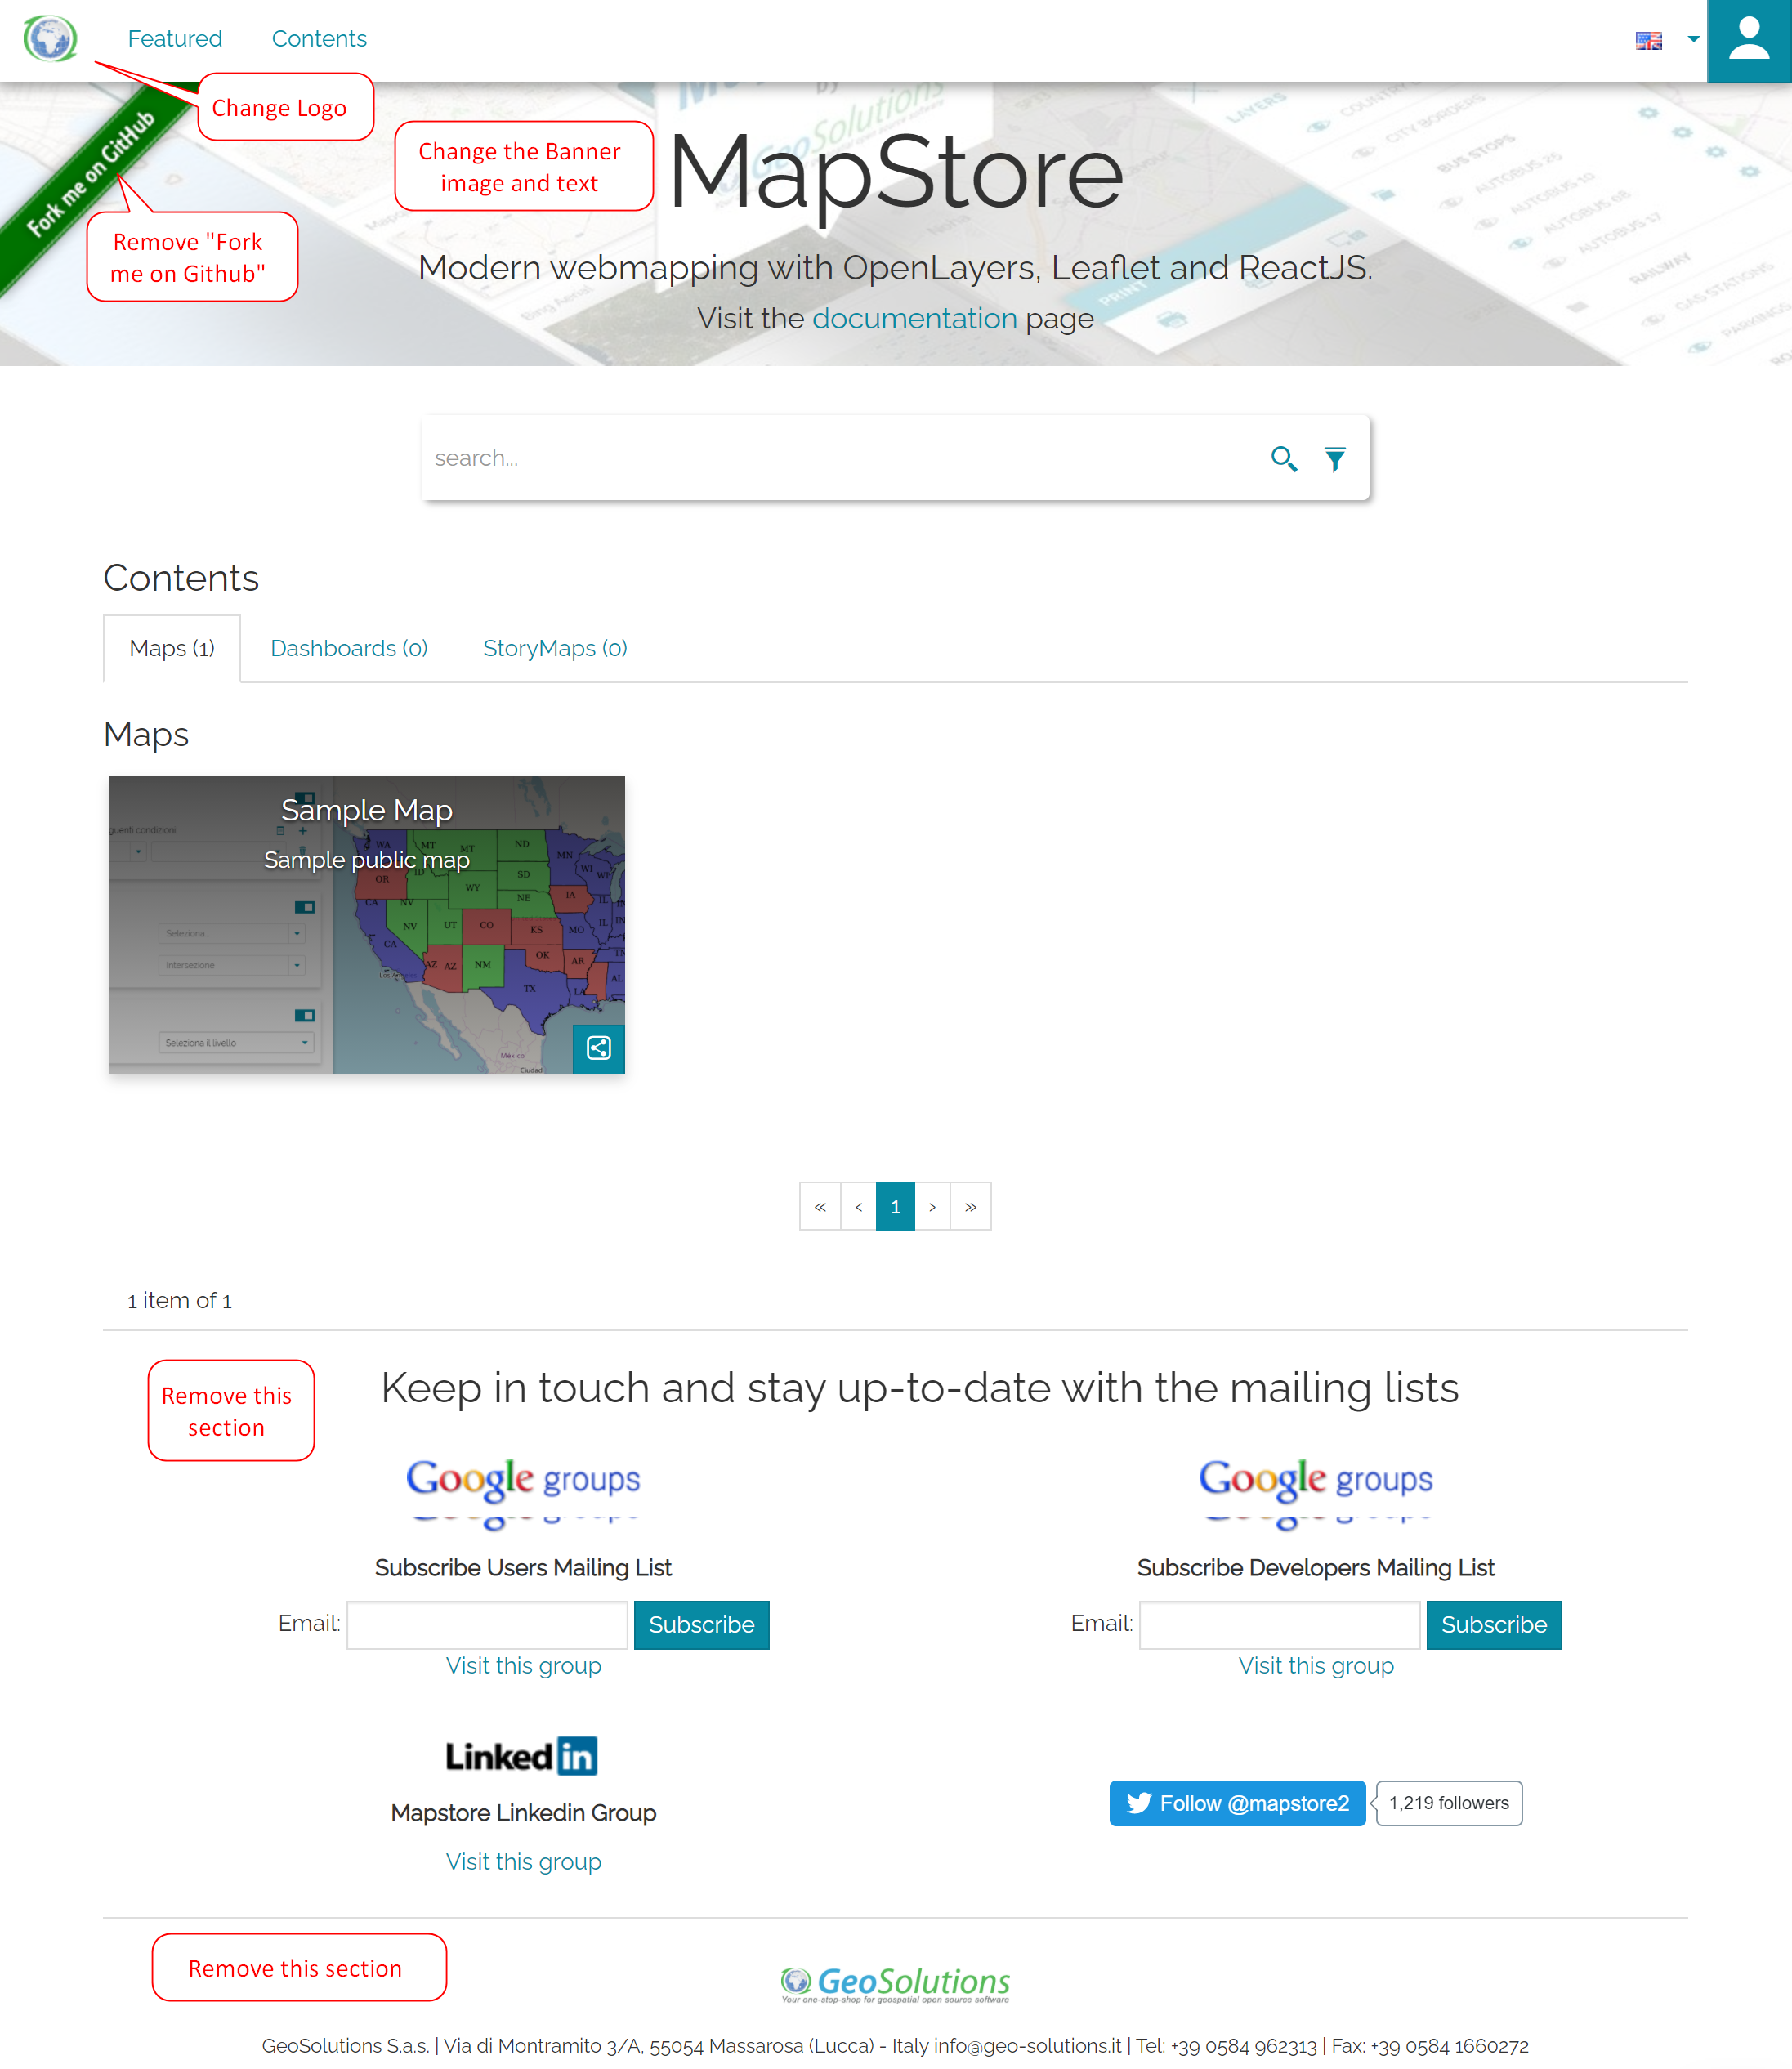
So to change the looks of the default interface, I need to make some minor changes to the configurations files - see the Developer Guide Configuration section. I’m only making some changes to the front end configuration files, mainly the following files:

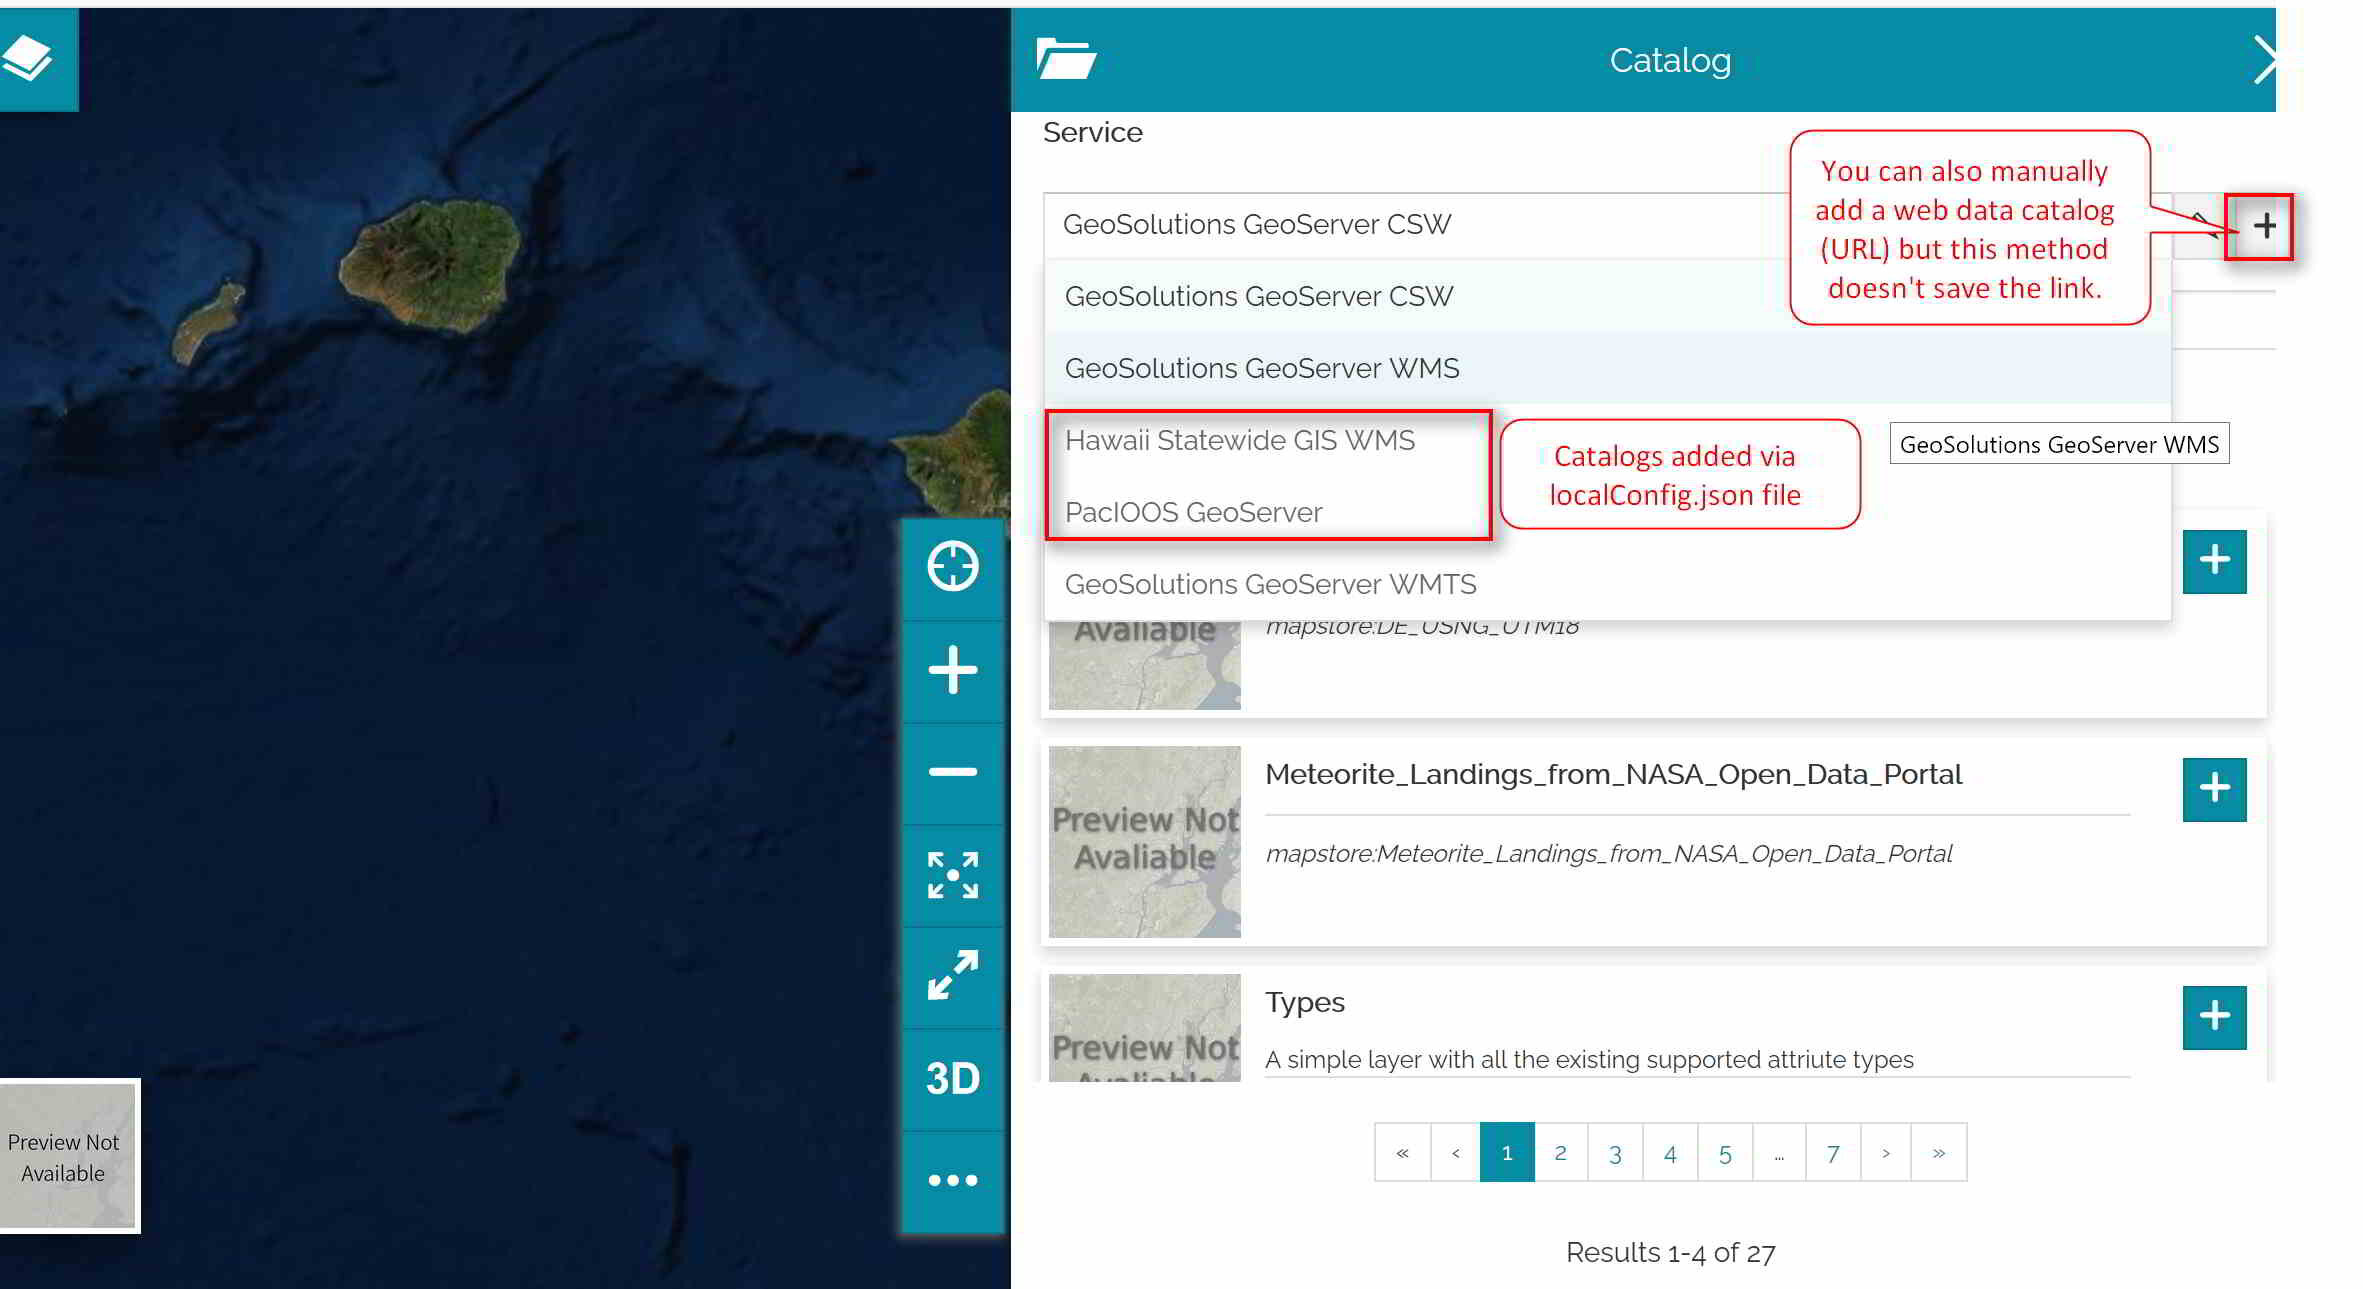
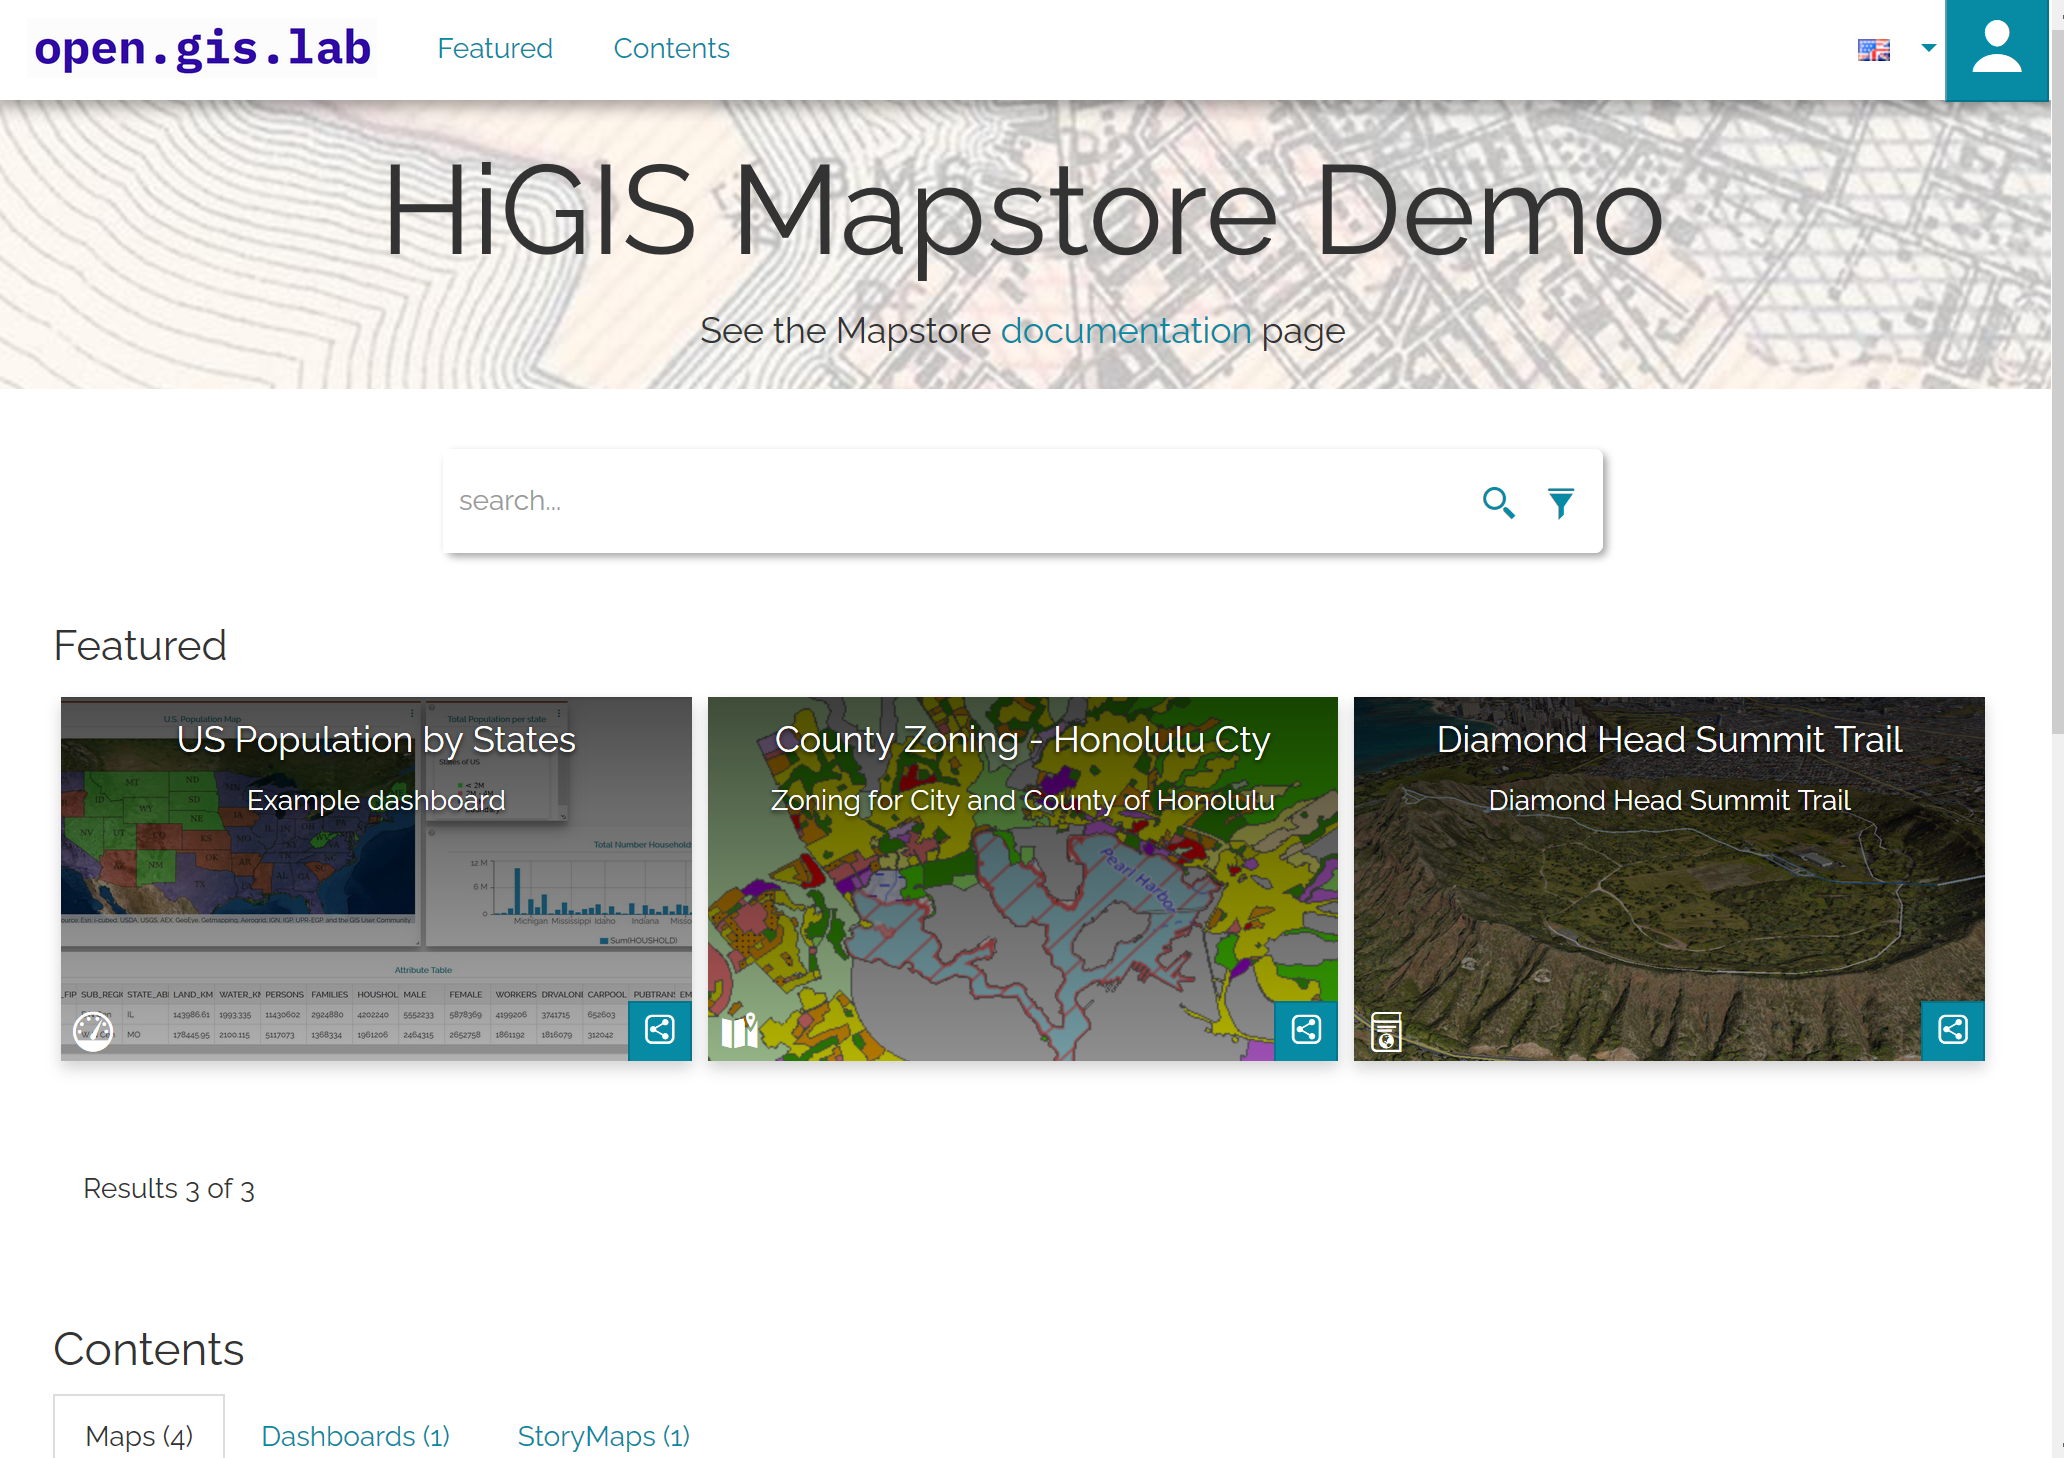
localConfig.json: this is the configuration file where you can over ride the logo, customize the banner title, and remove the mailing list and footer. This is also where you can specify your data catalog(s) for the application. Because I don’t have current have a GeoServer to serve as a data catalog I included two public ones: Hawaii Statewide GIS Program’s ESRI Mapserver (WMS) and PacIOOS’s Geoserver (OWS).

new.json: this is the file where you can make changes to the default setting when creating a new map. For my configuration, I have set the map extent to show the Hawaiian Islands, change the CRS to EPSG 4326, zoom level, and added two new basemaps (Stamen terrain and ESRI Imagery).

data-en-US.json: this is the file where you can remove the “Fork me on Github” green banner and customize the subtitle in your banner (e.g. the HomeDescription text). This is the file for the English version of the application, but you can find other translation files in the Translations folder.

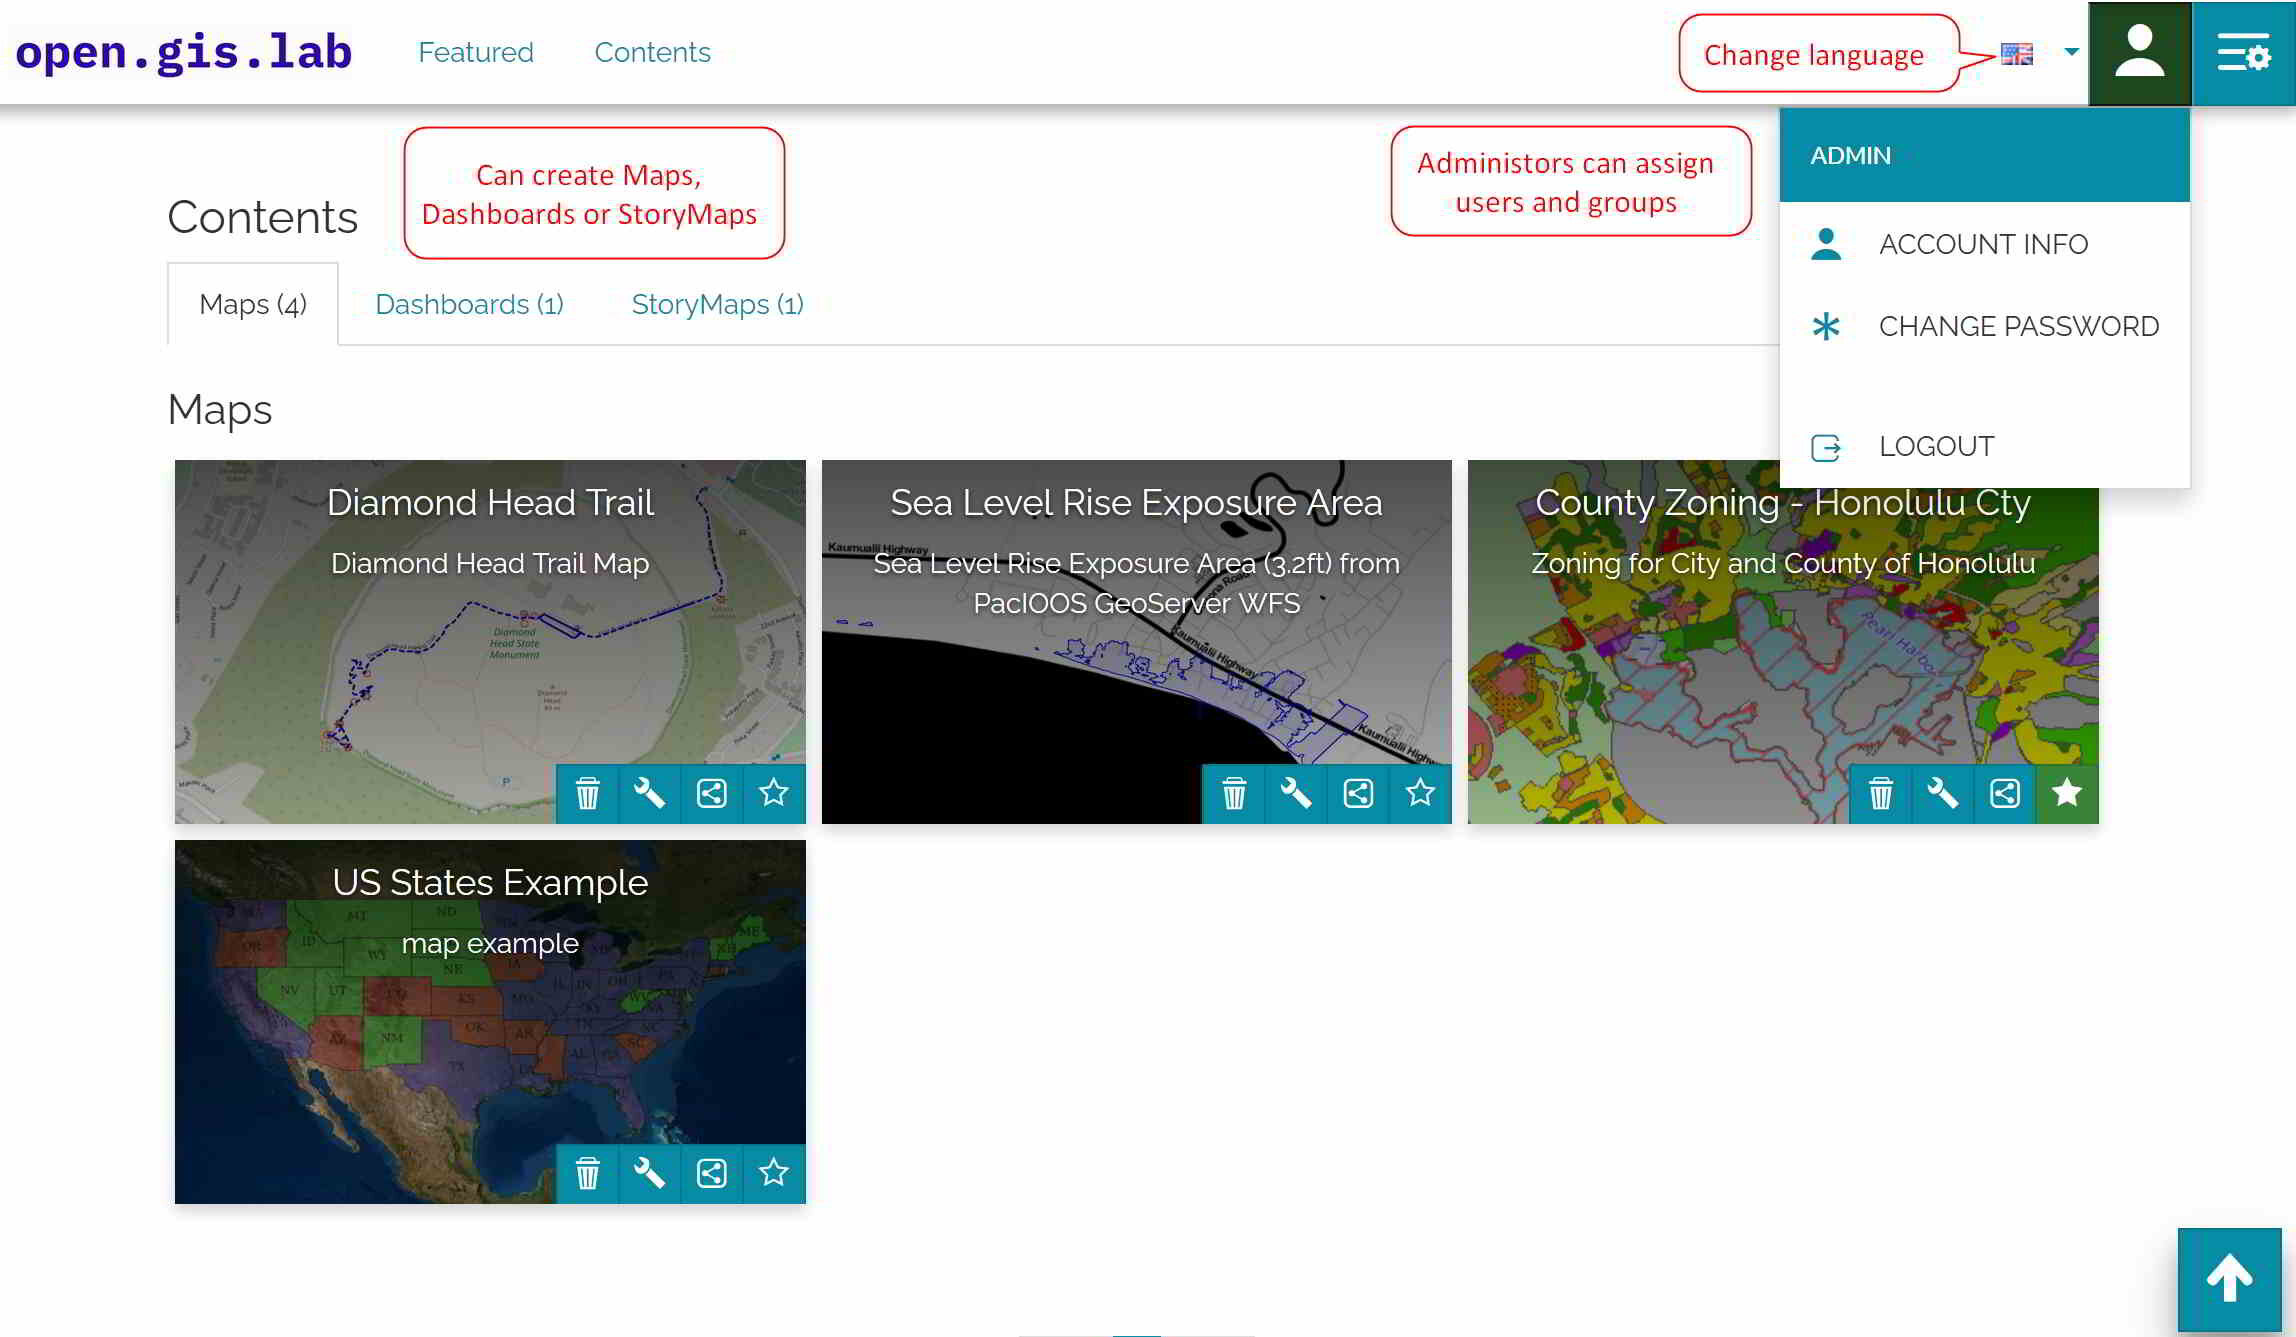
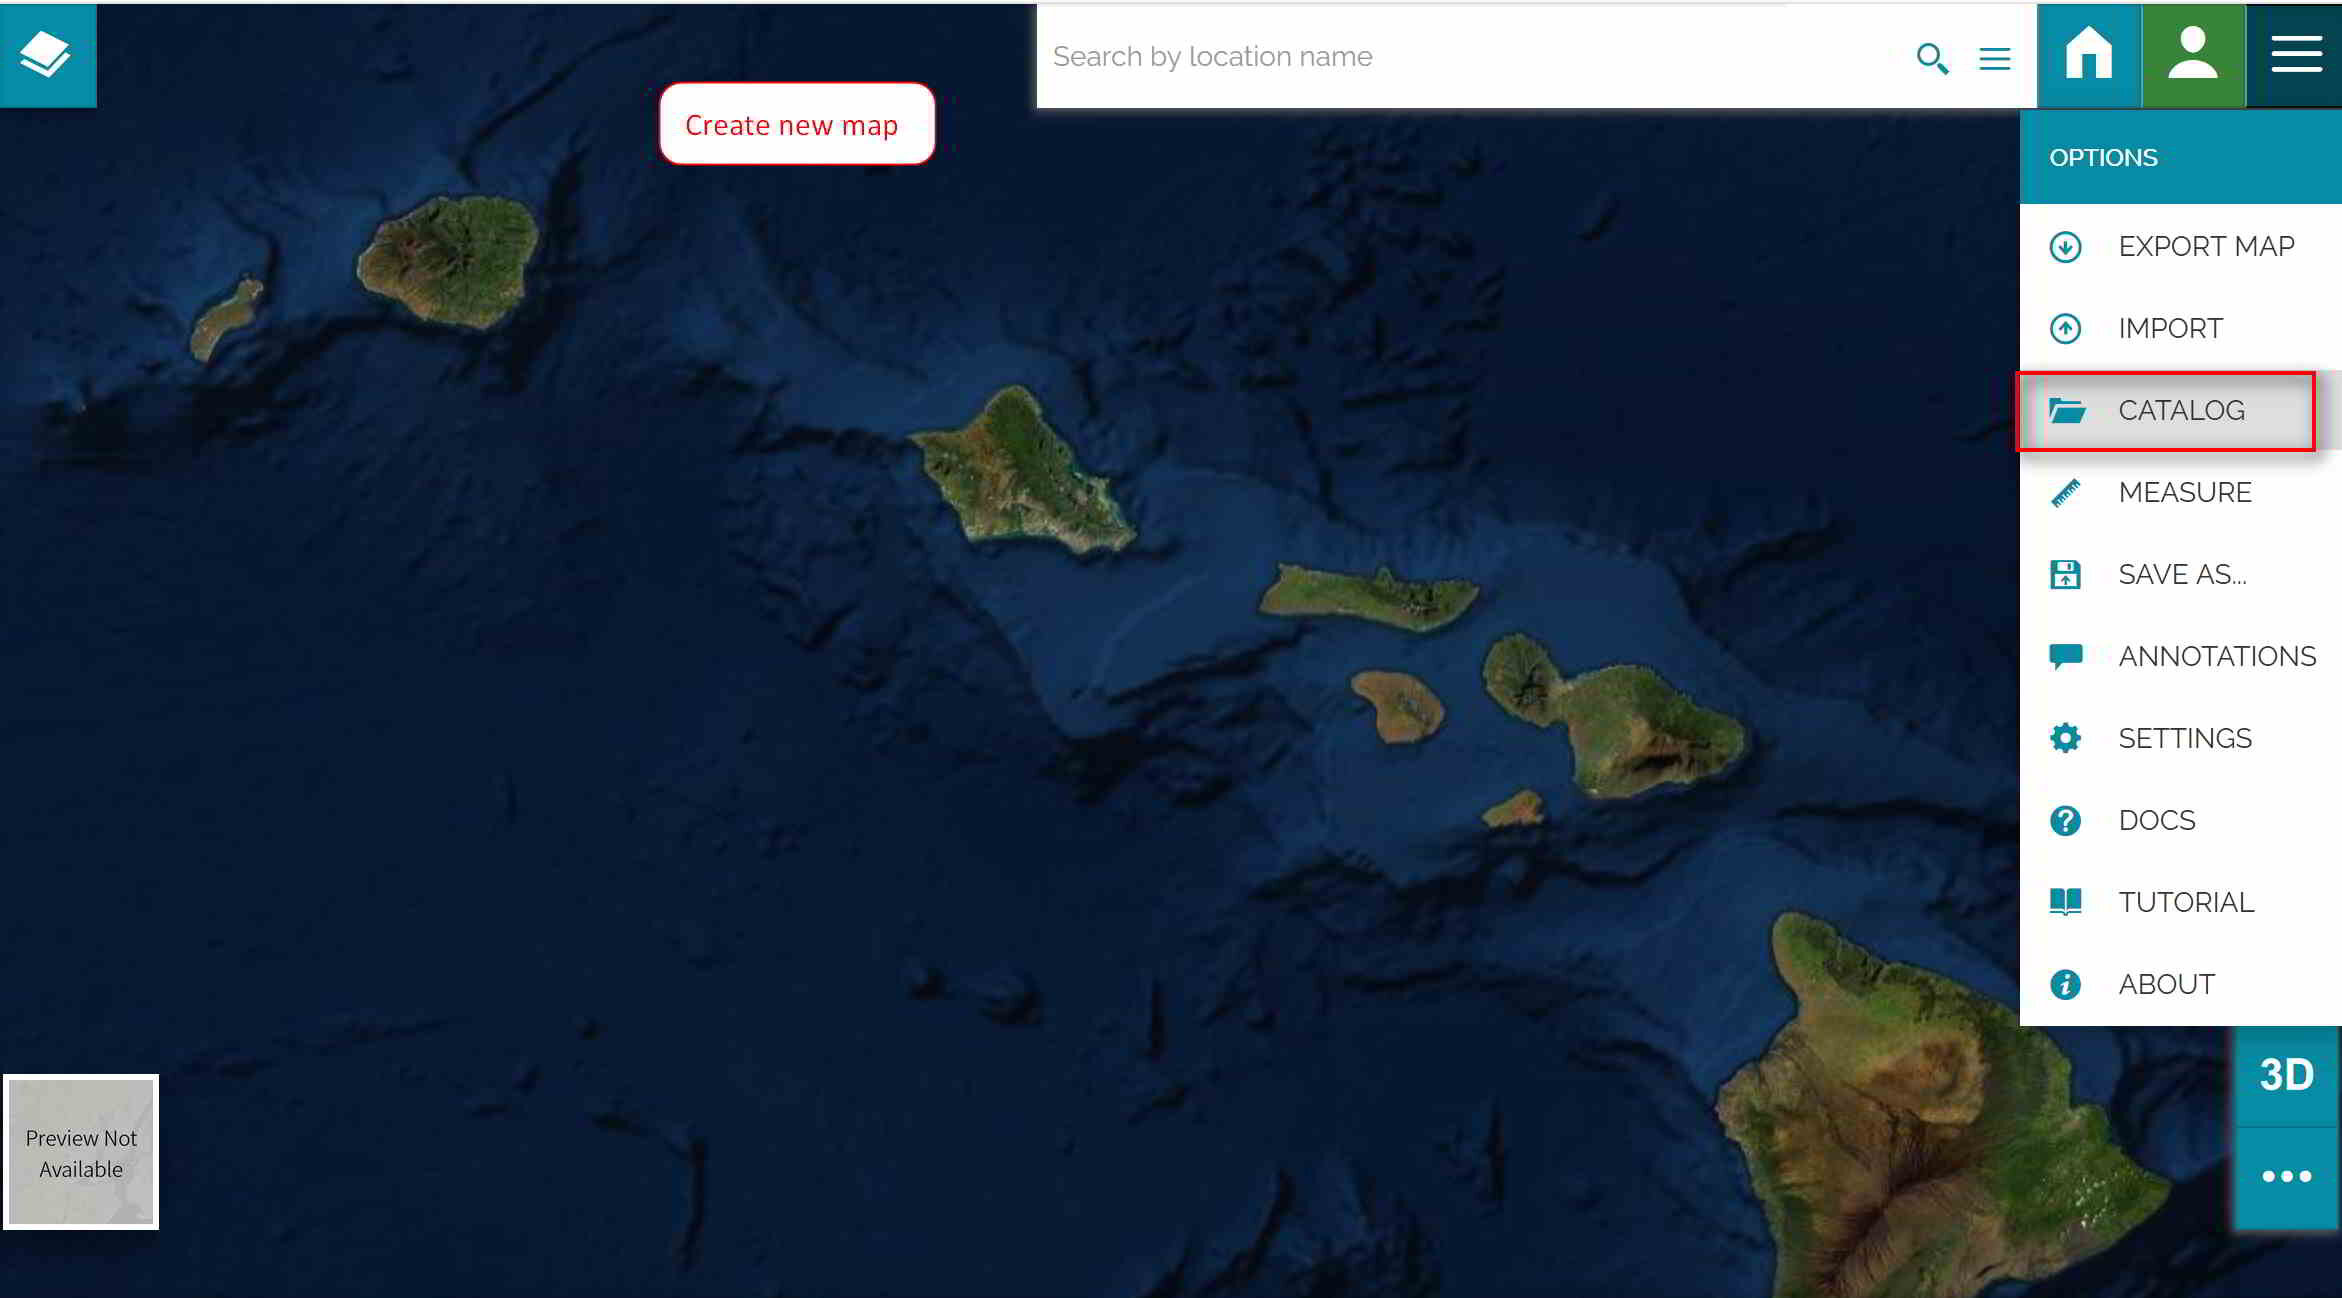
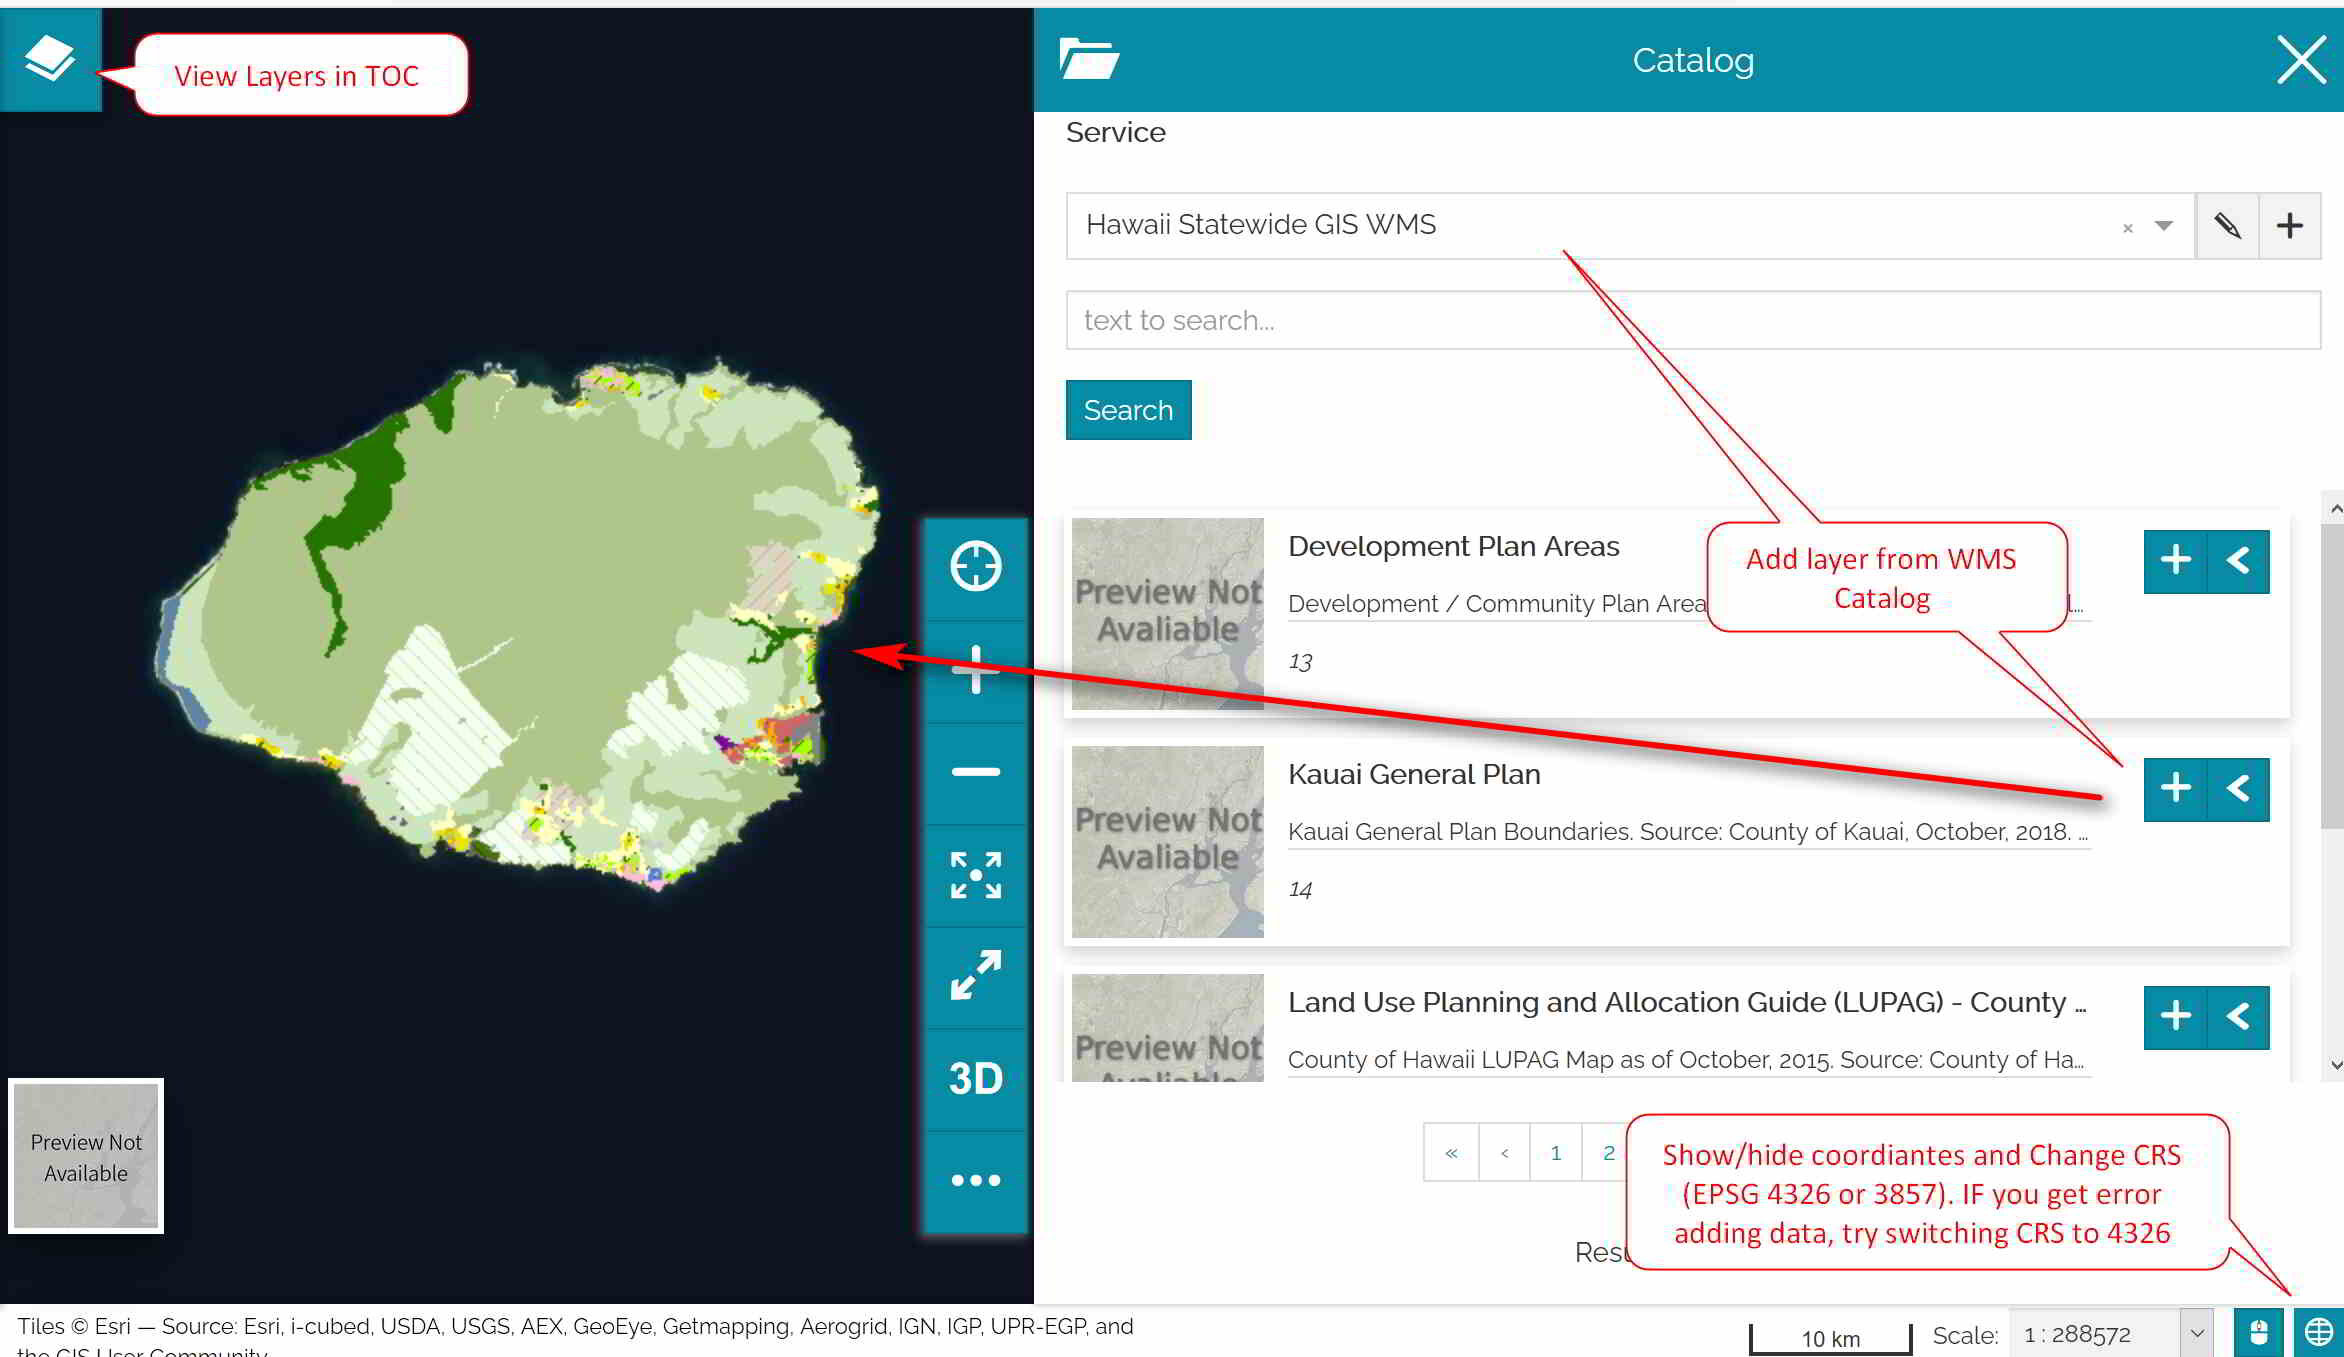
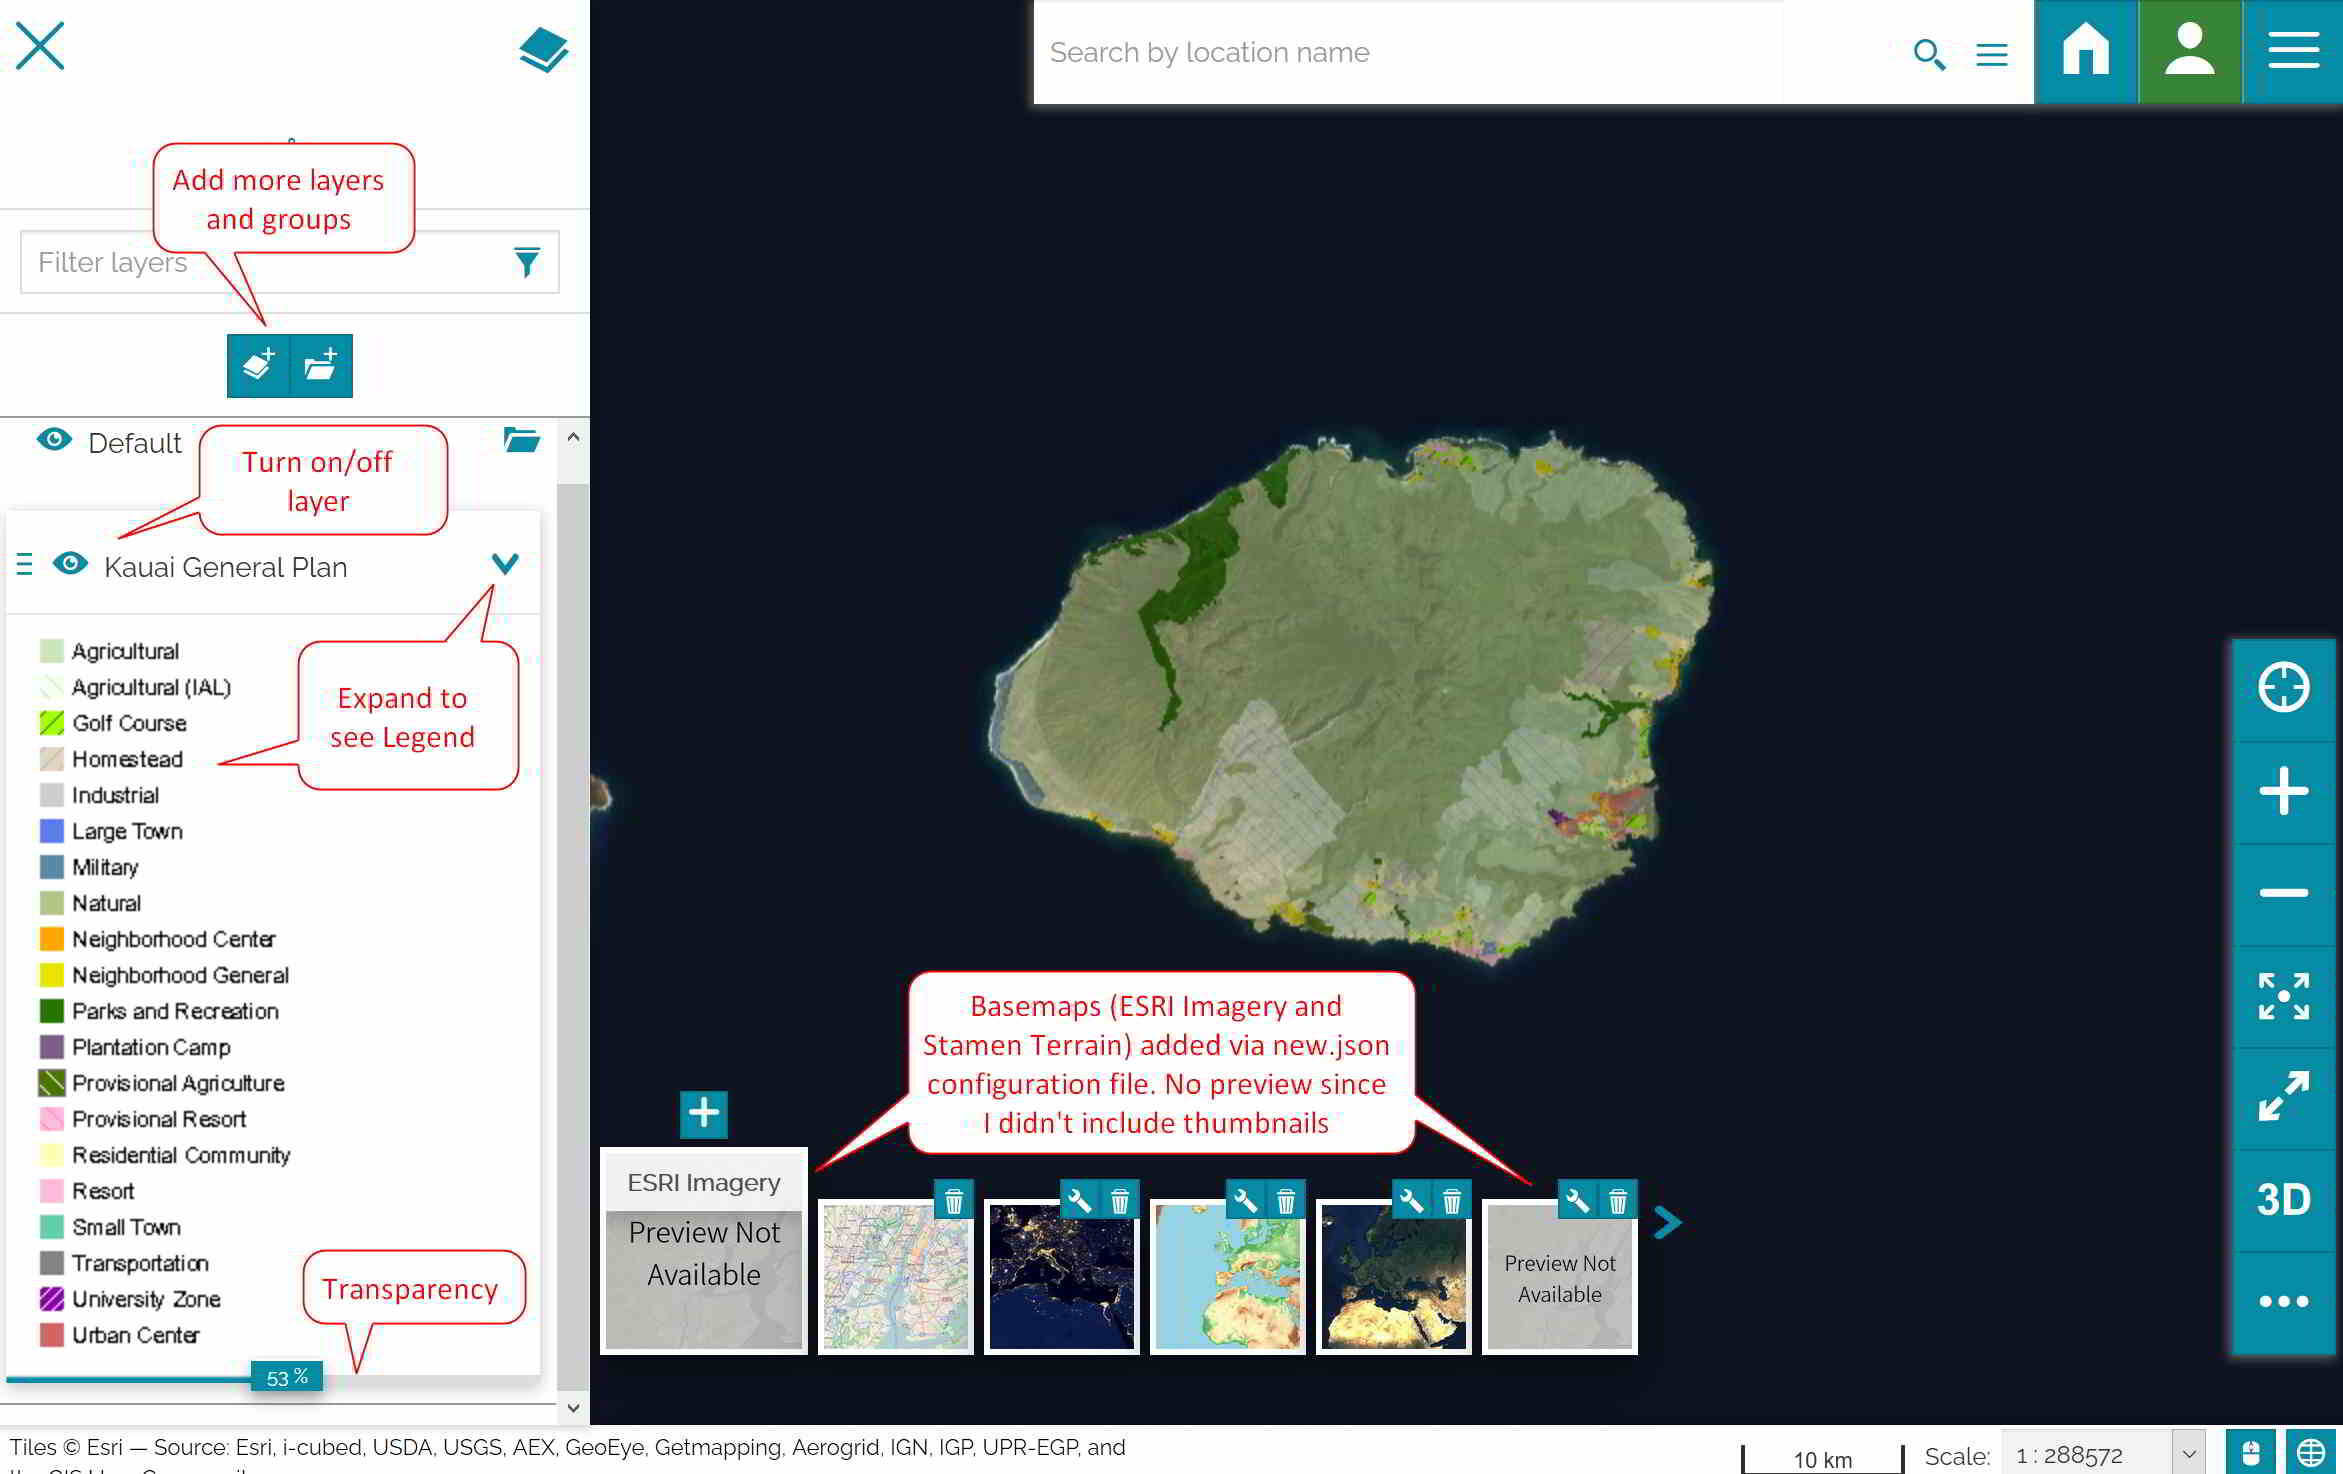
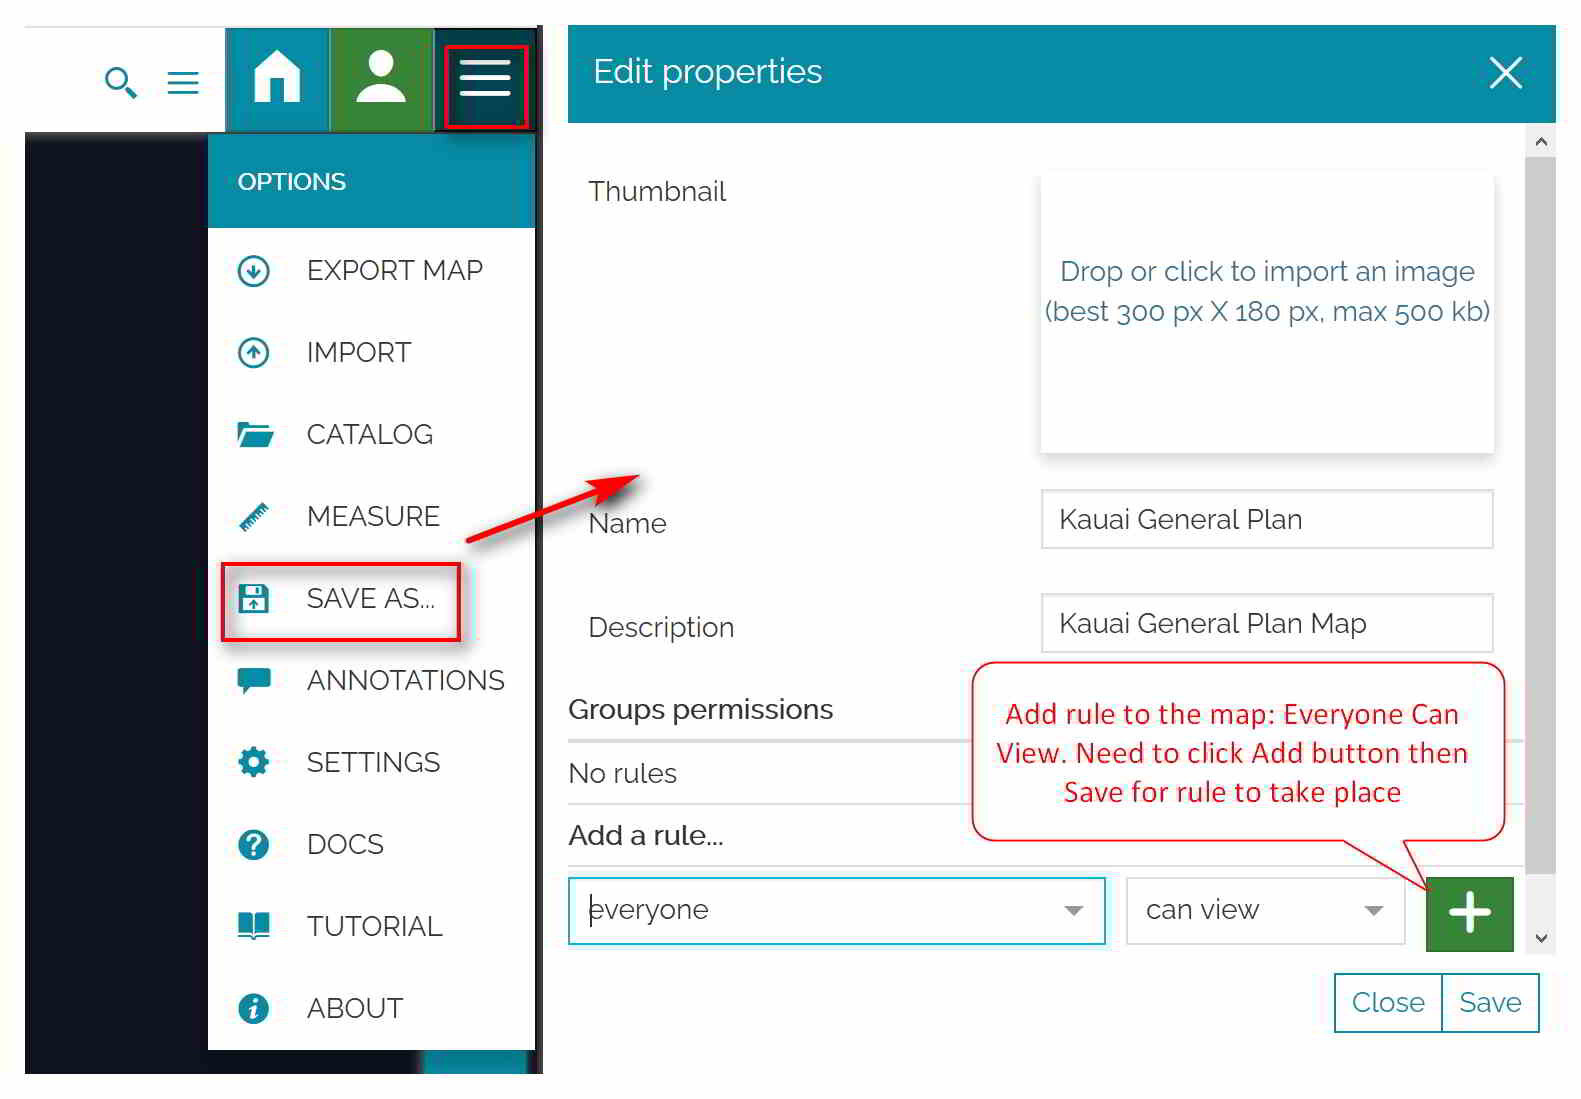
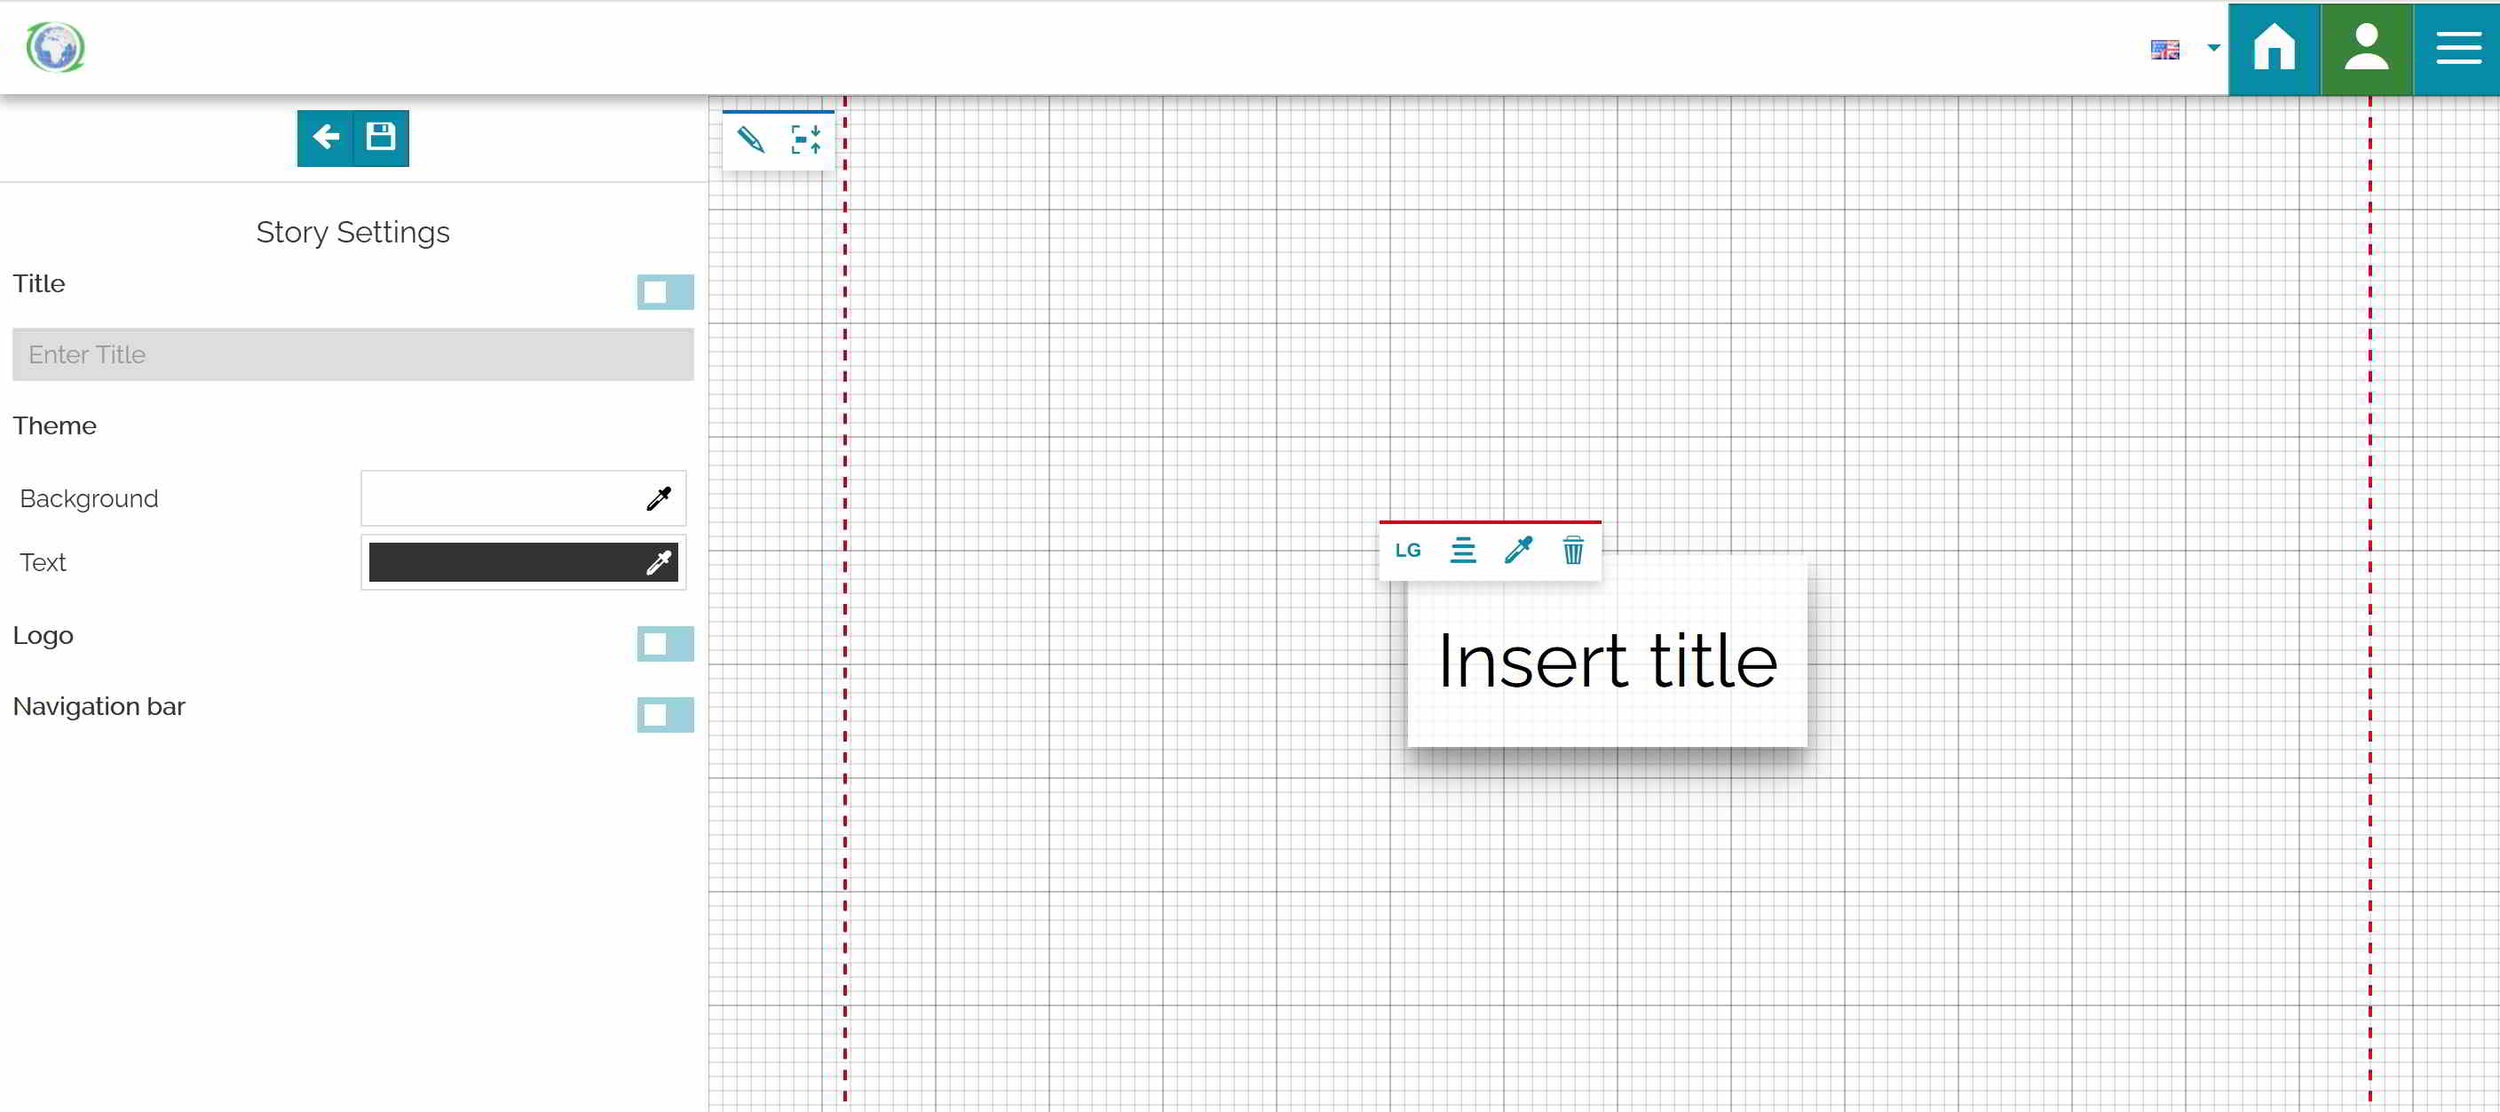
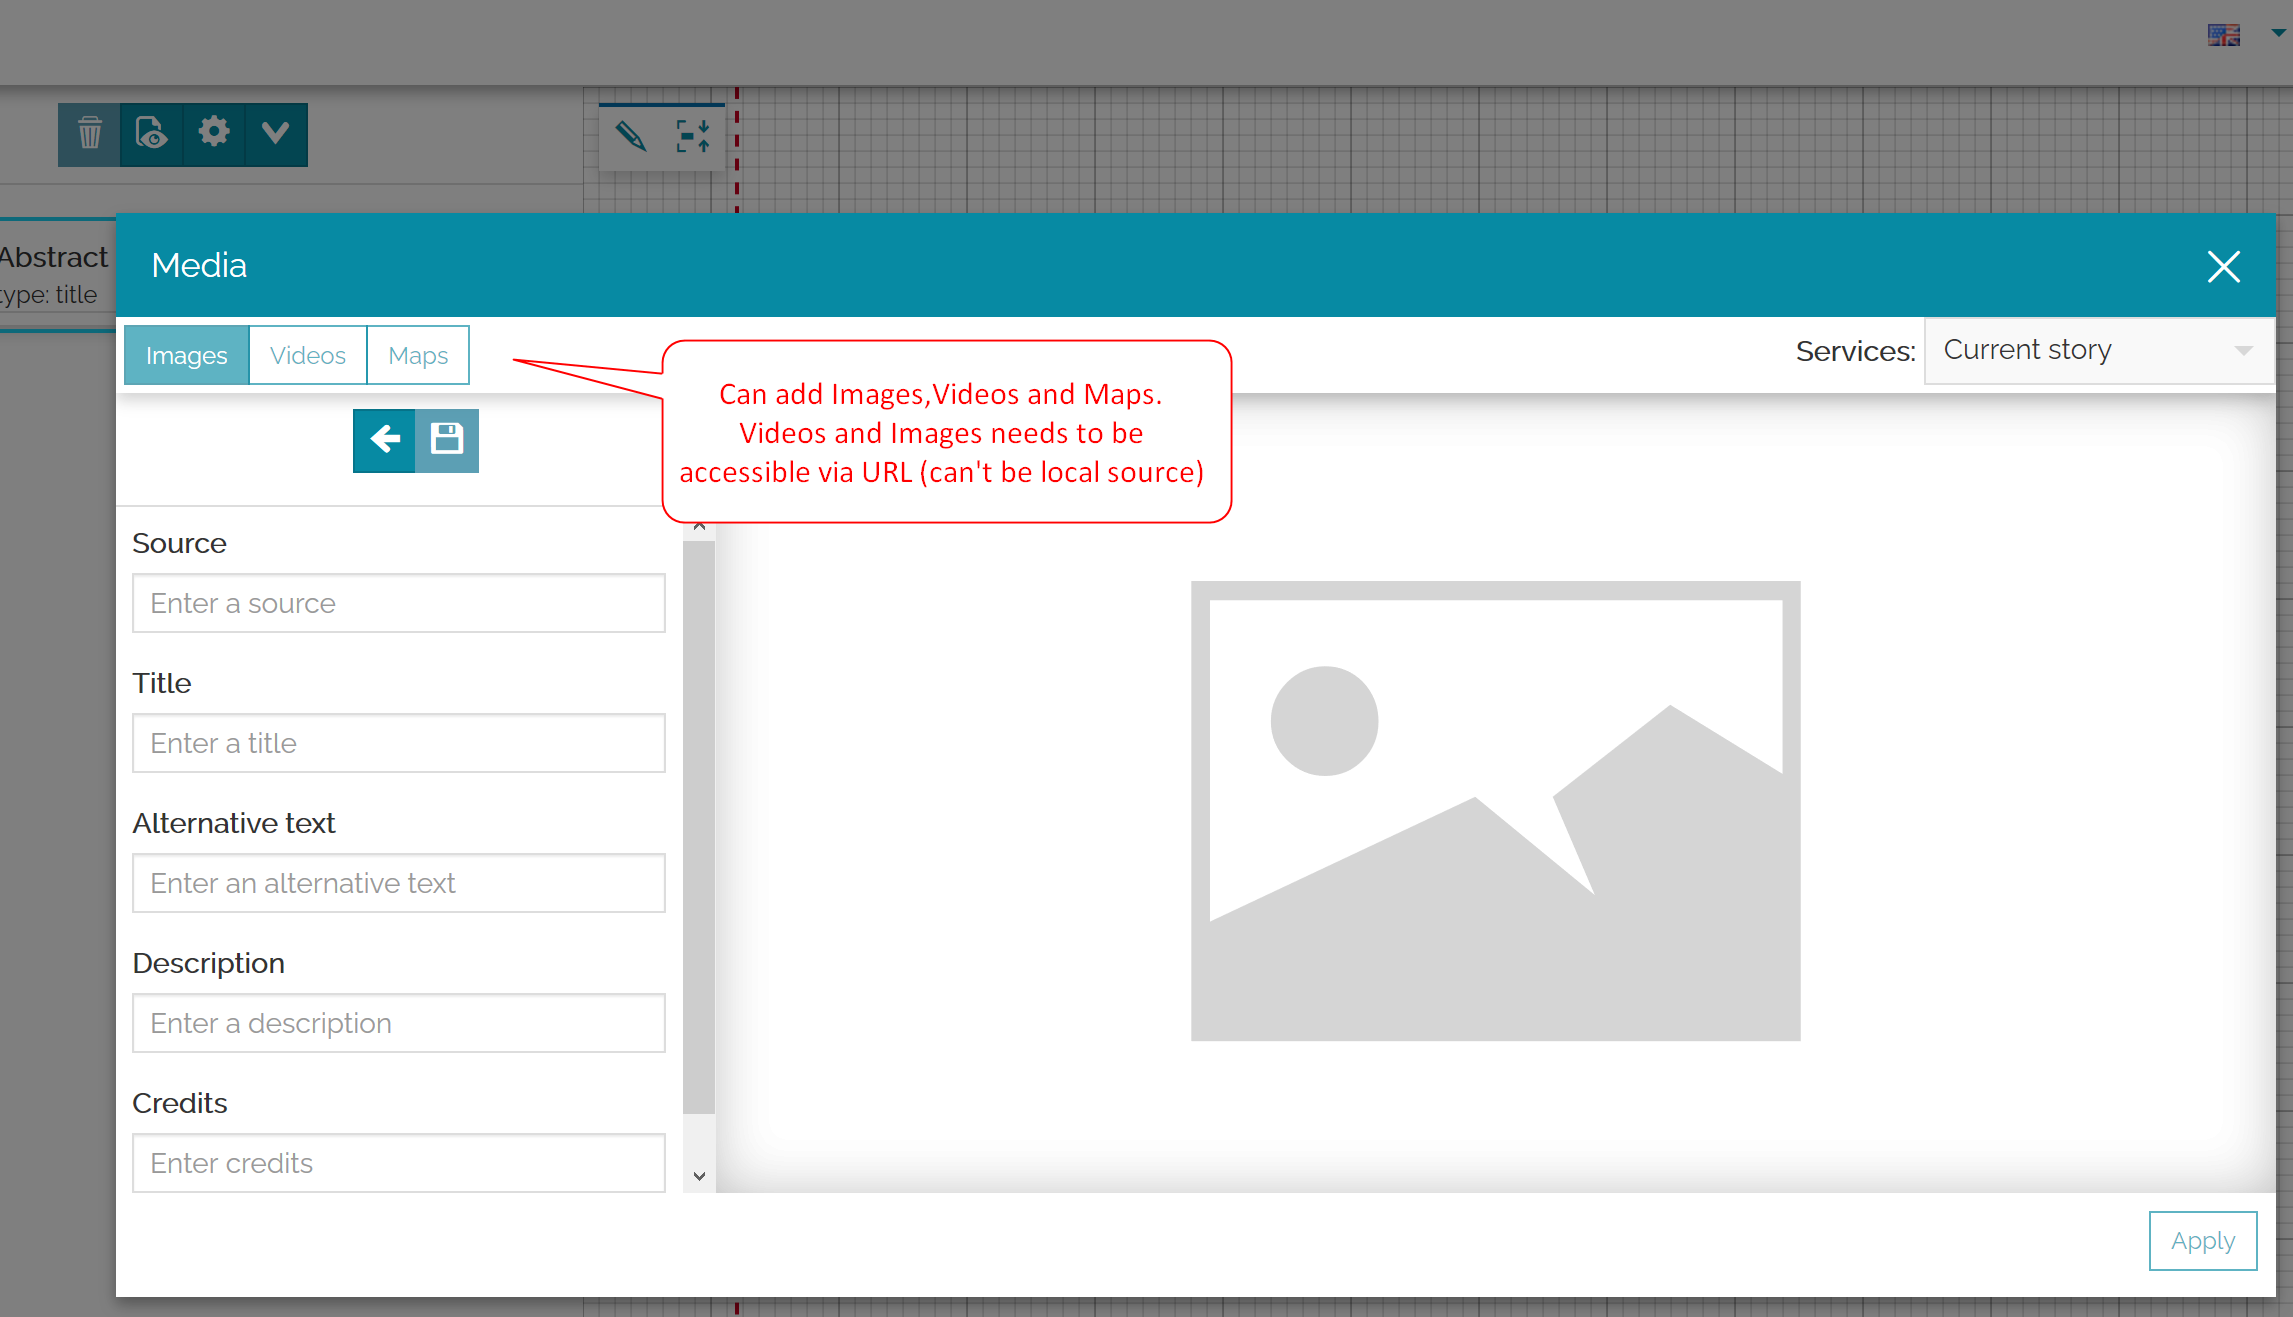
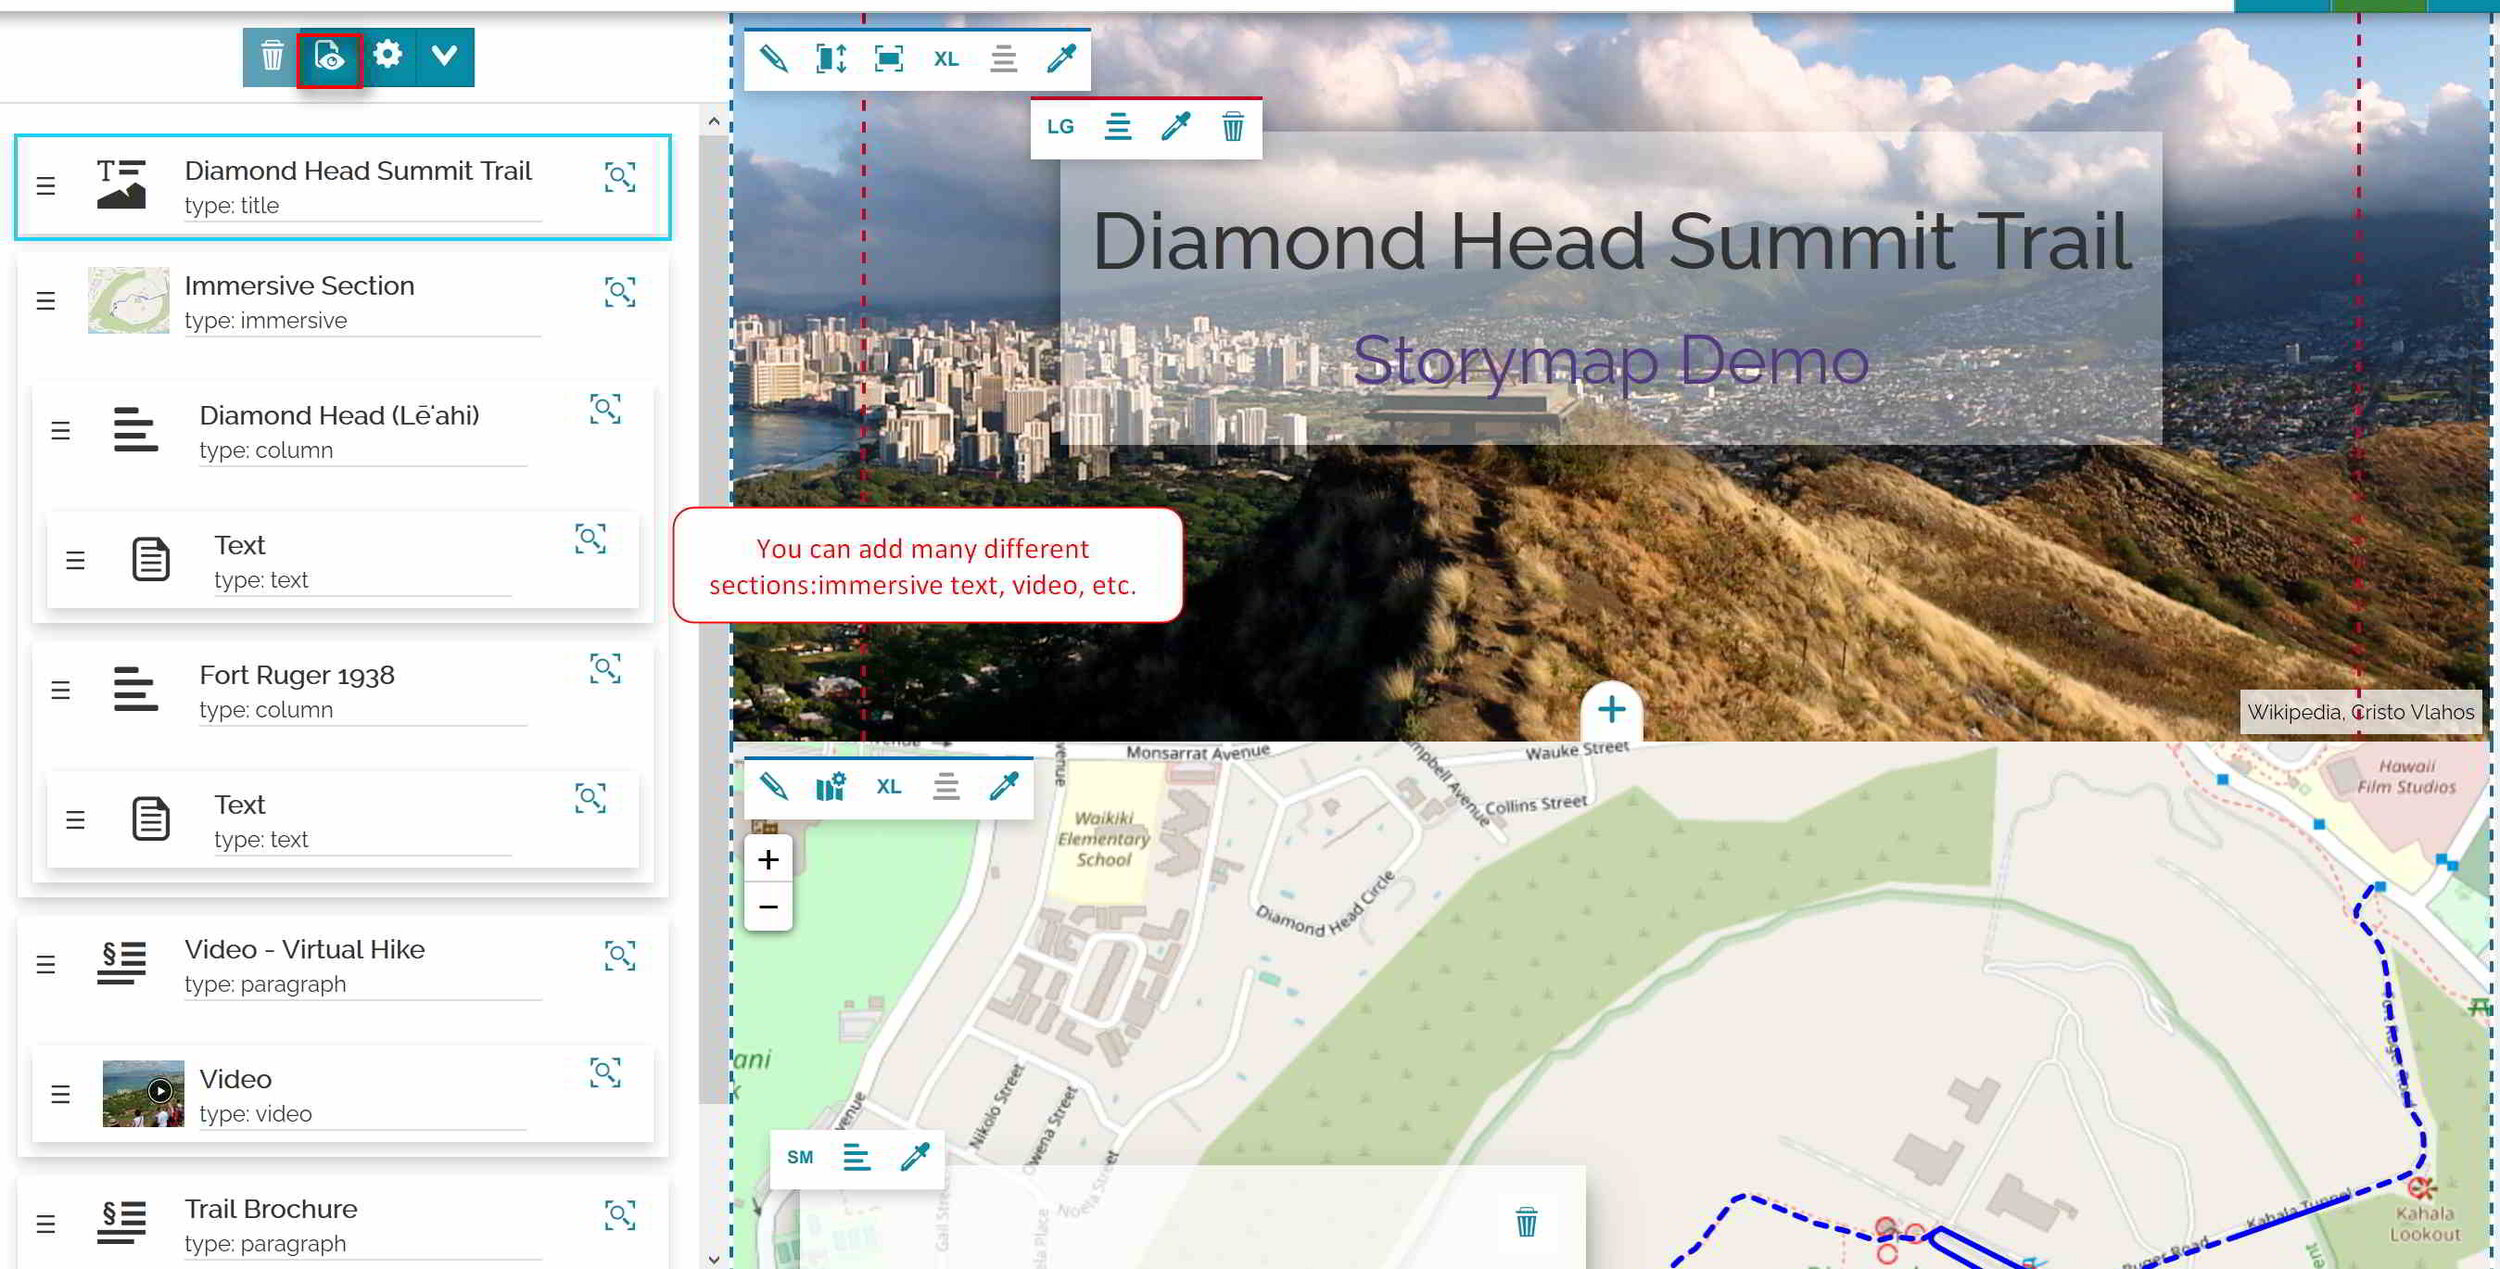
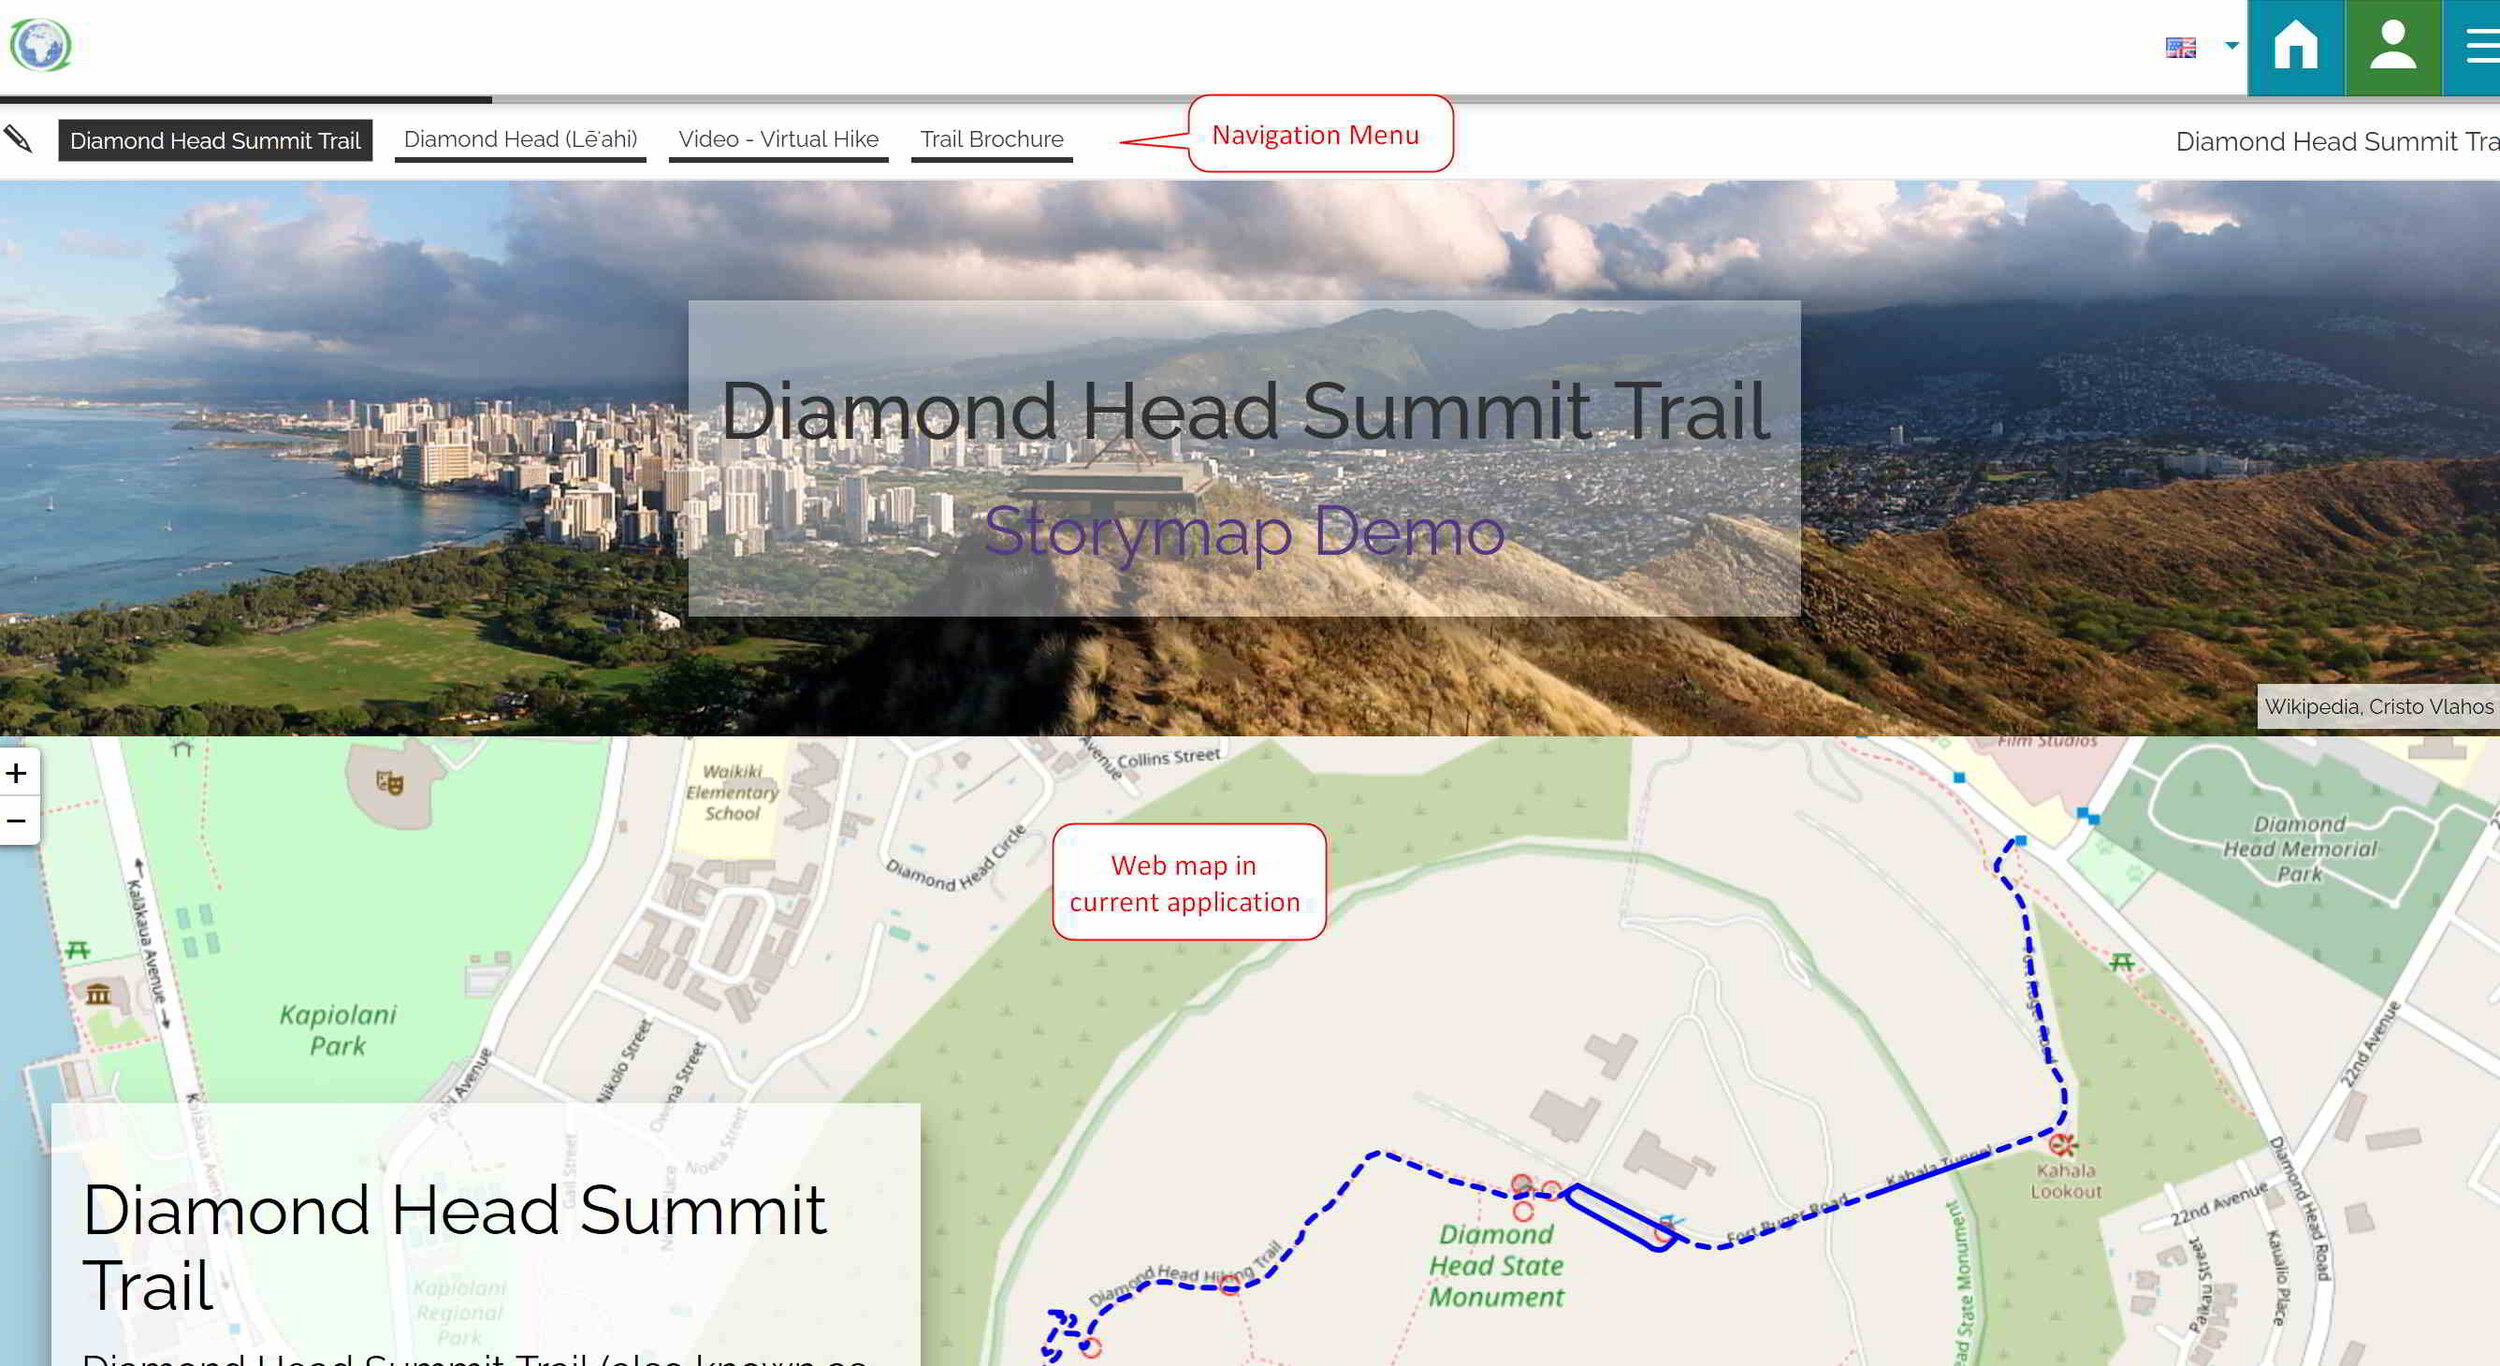
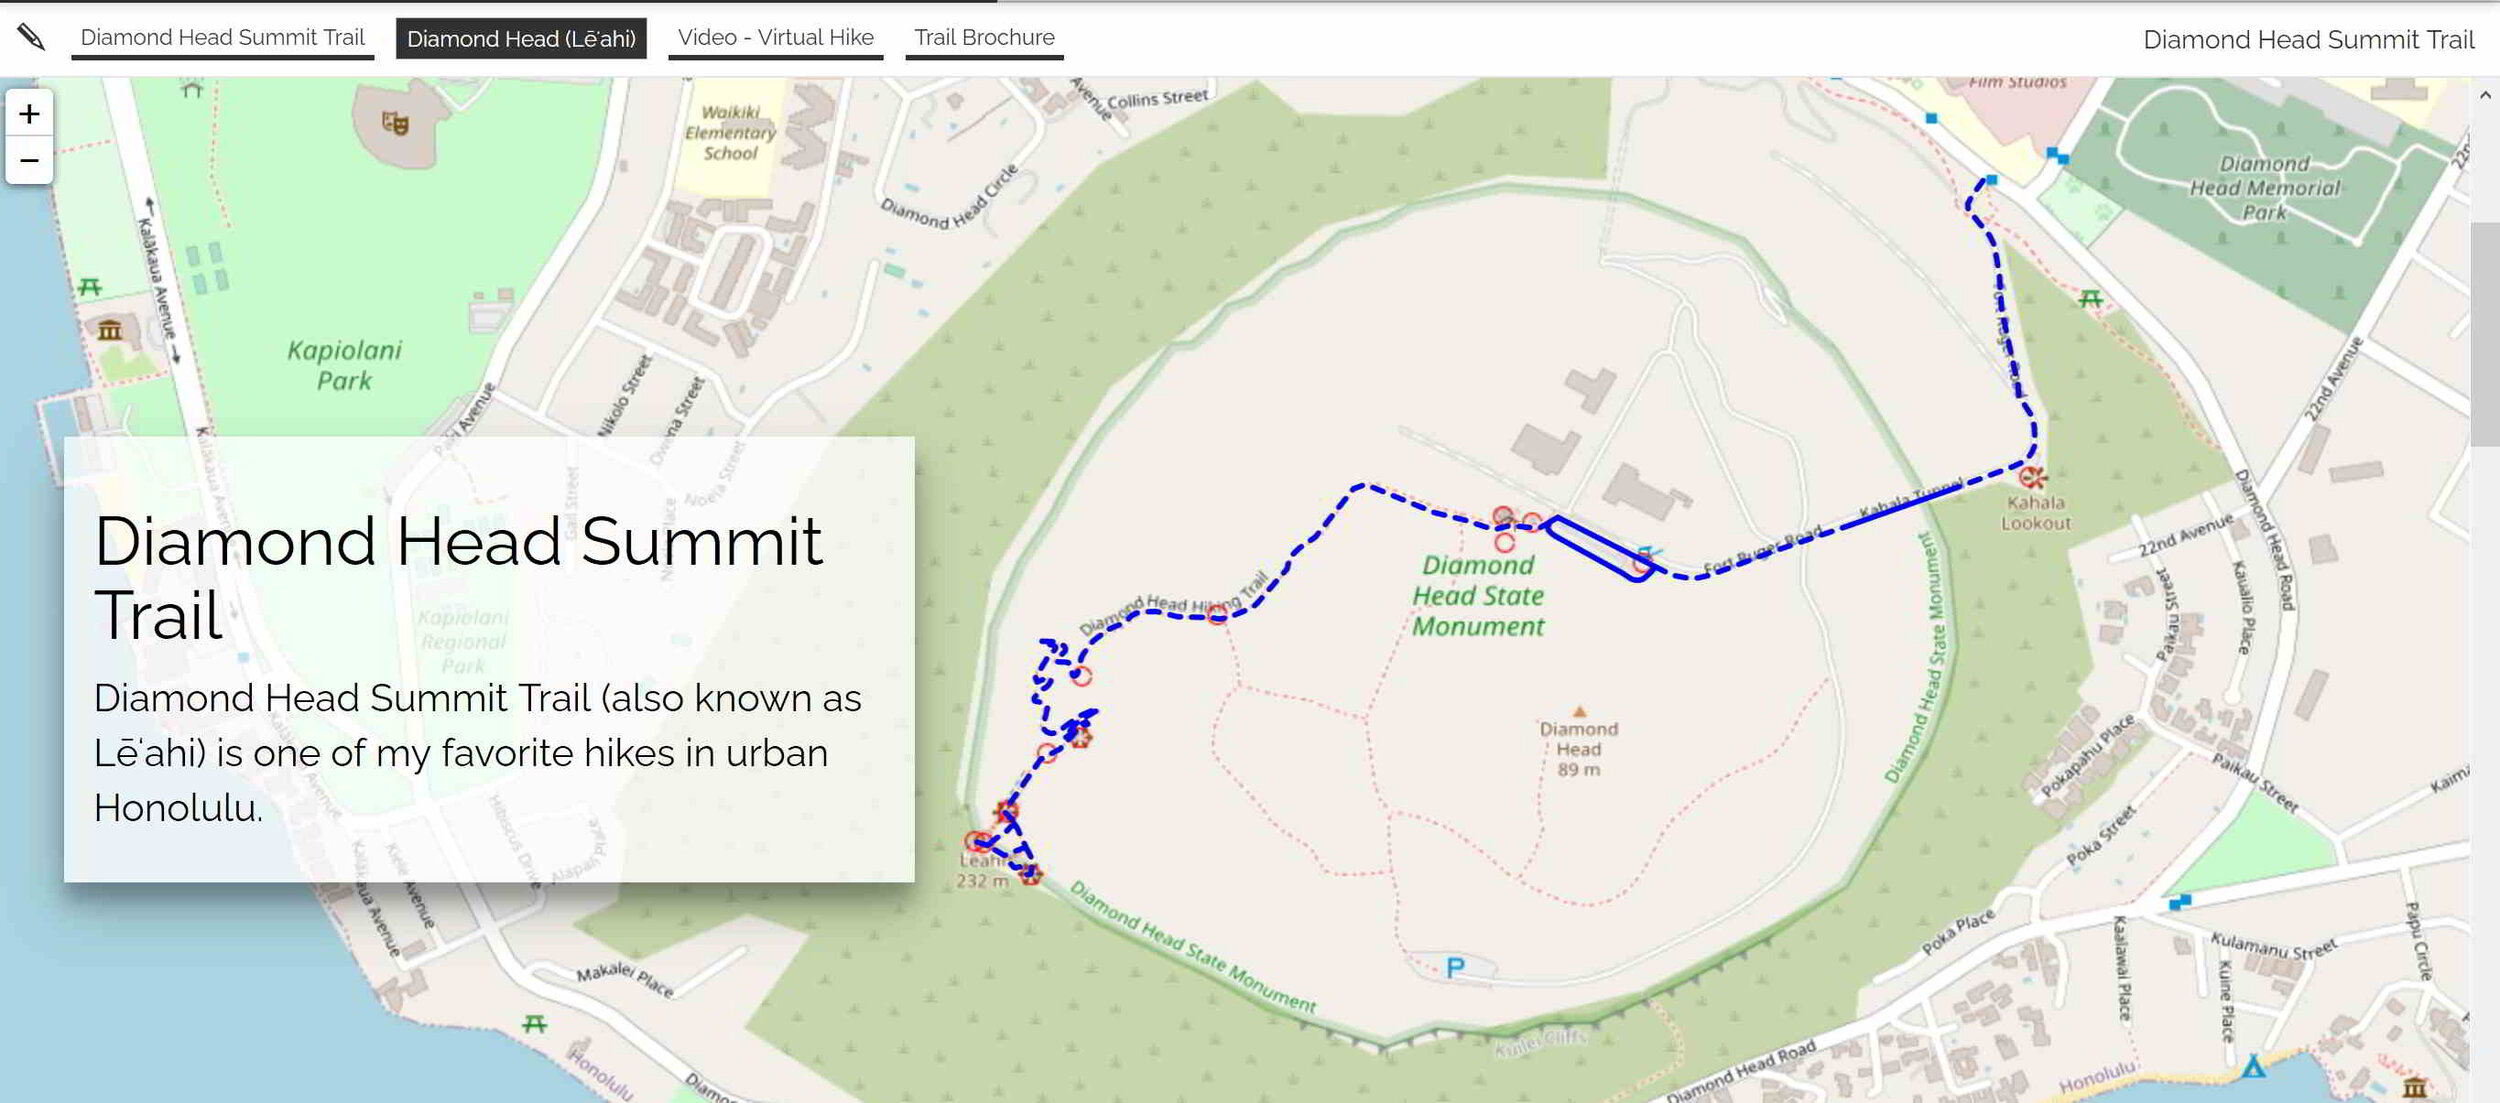
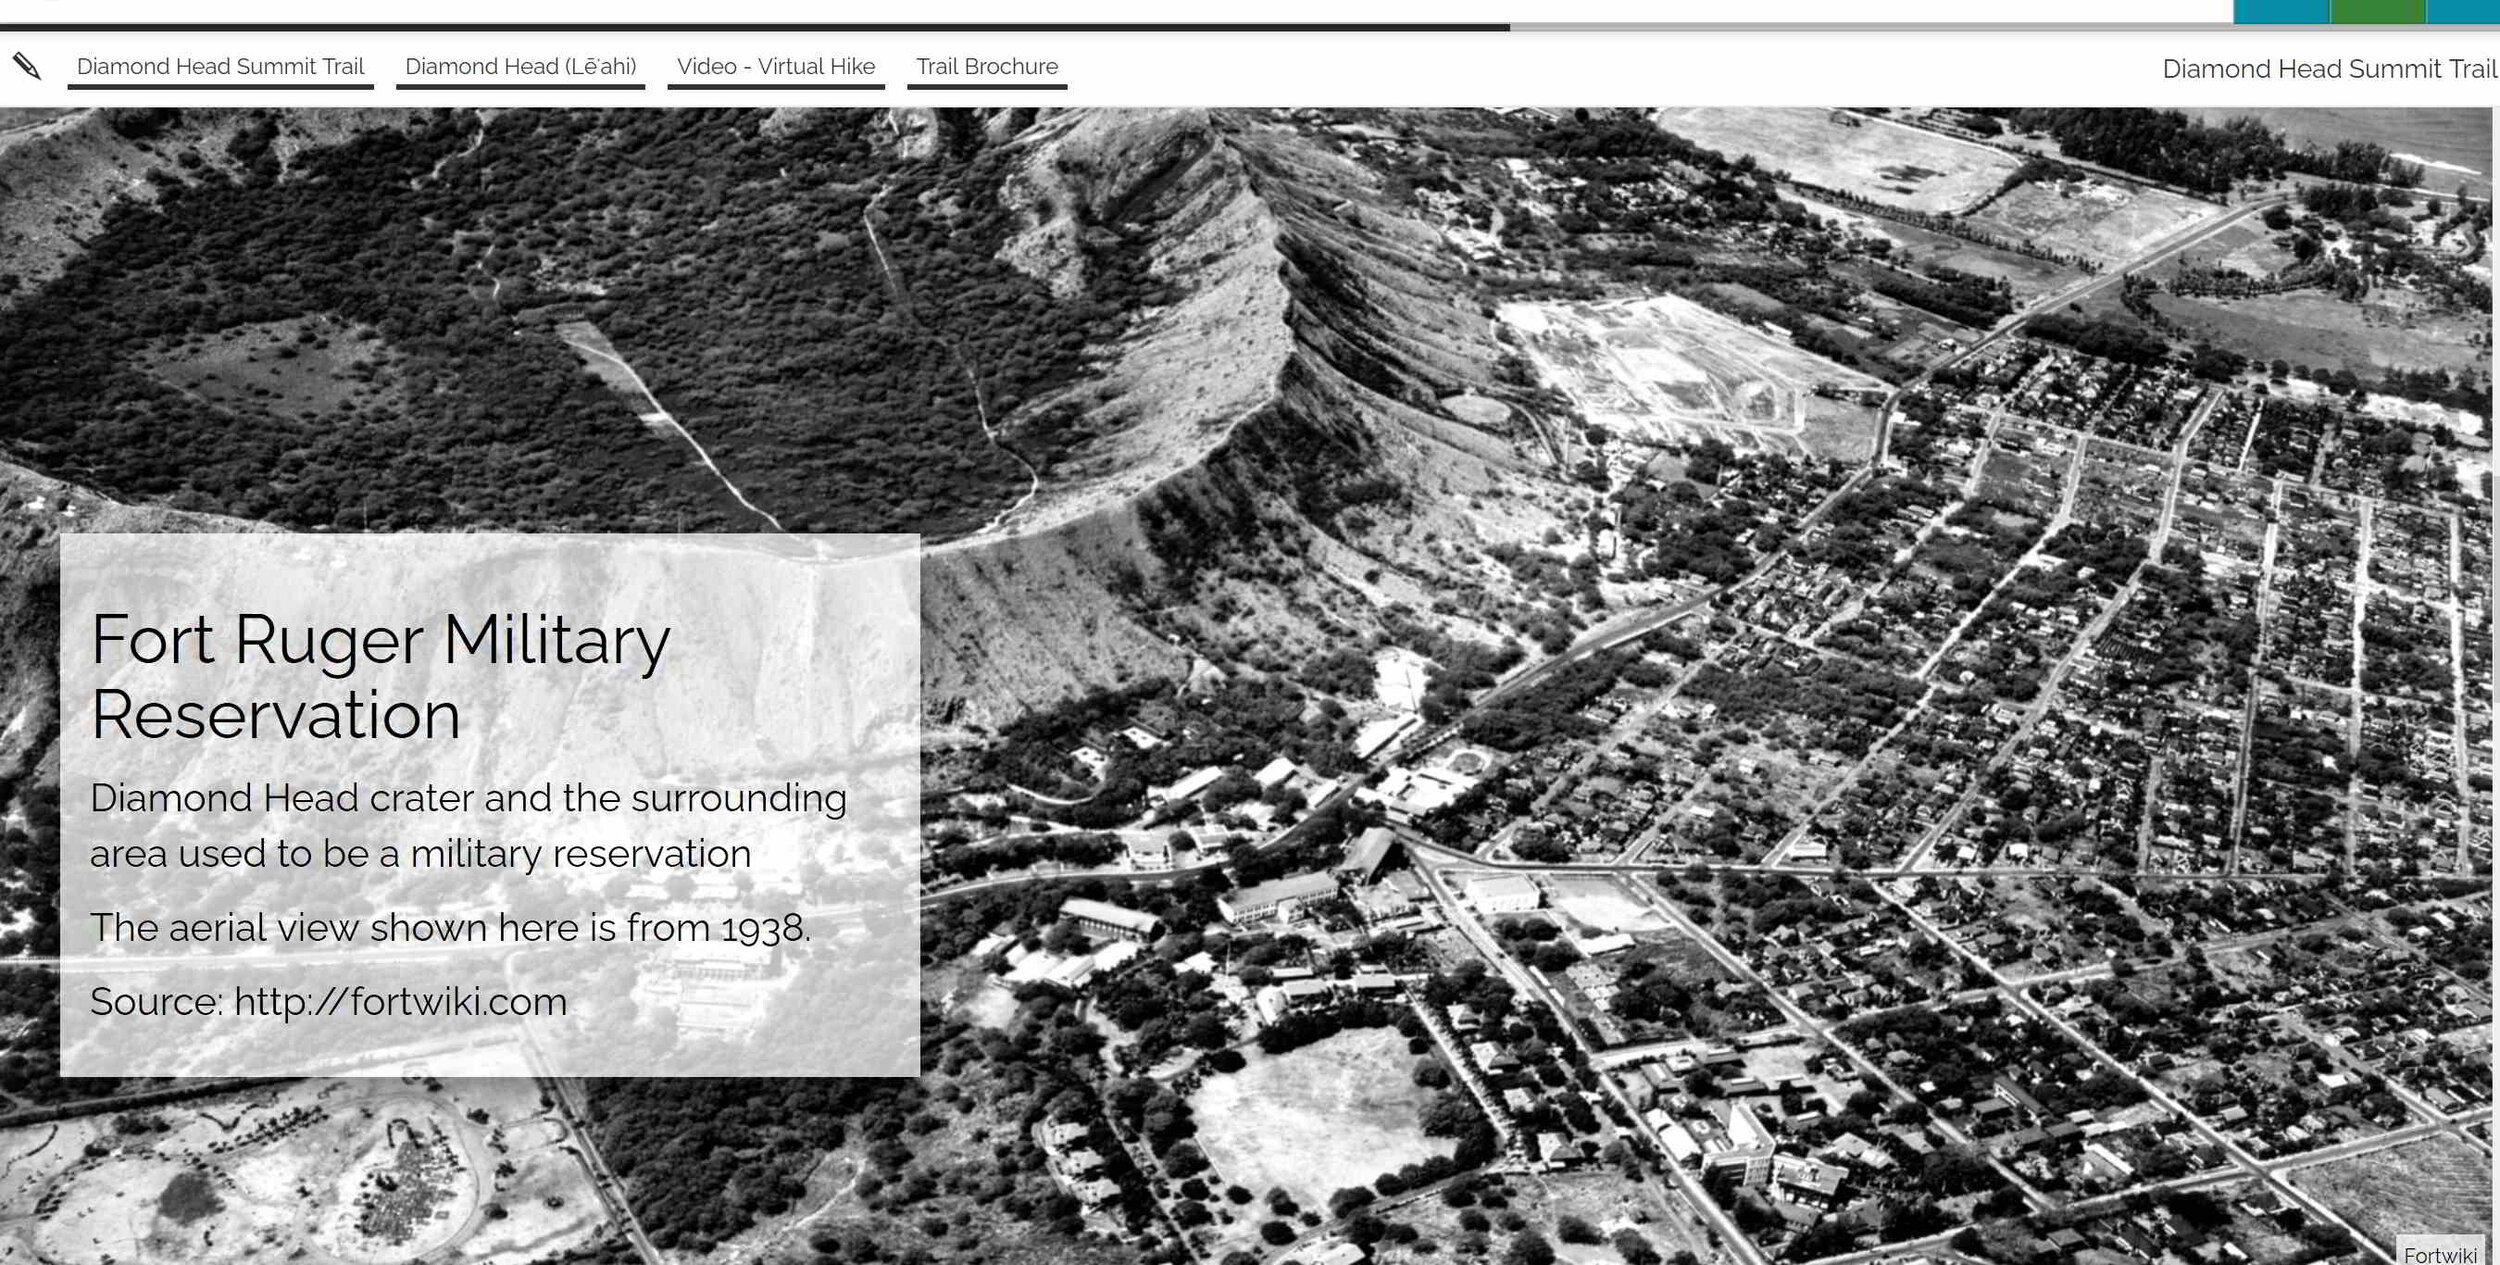
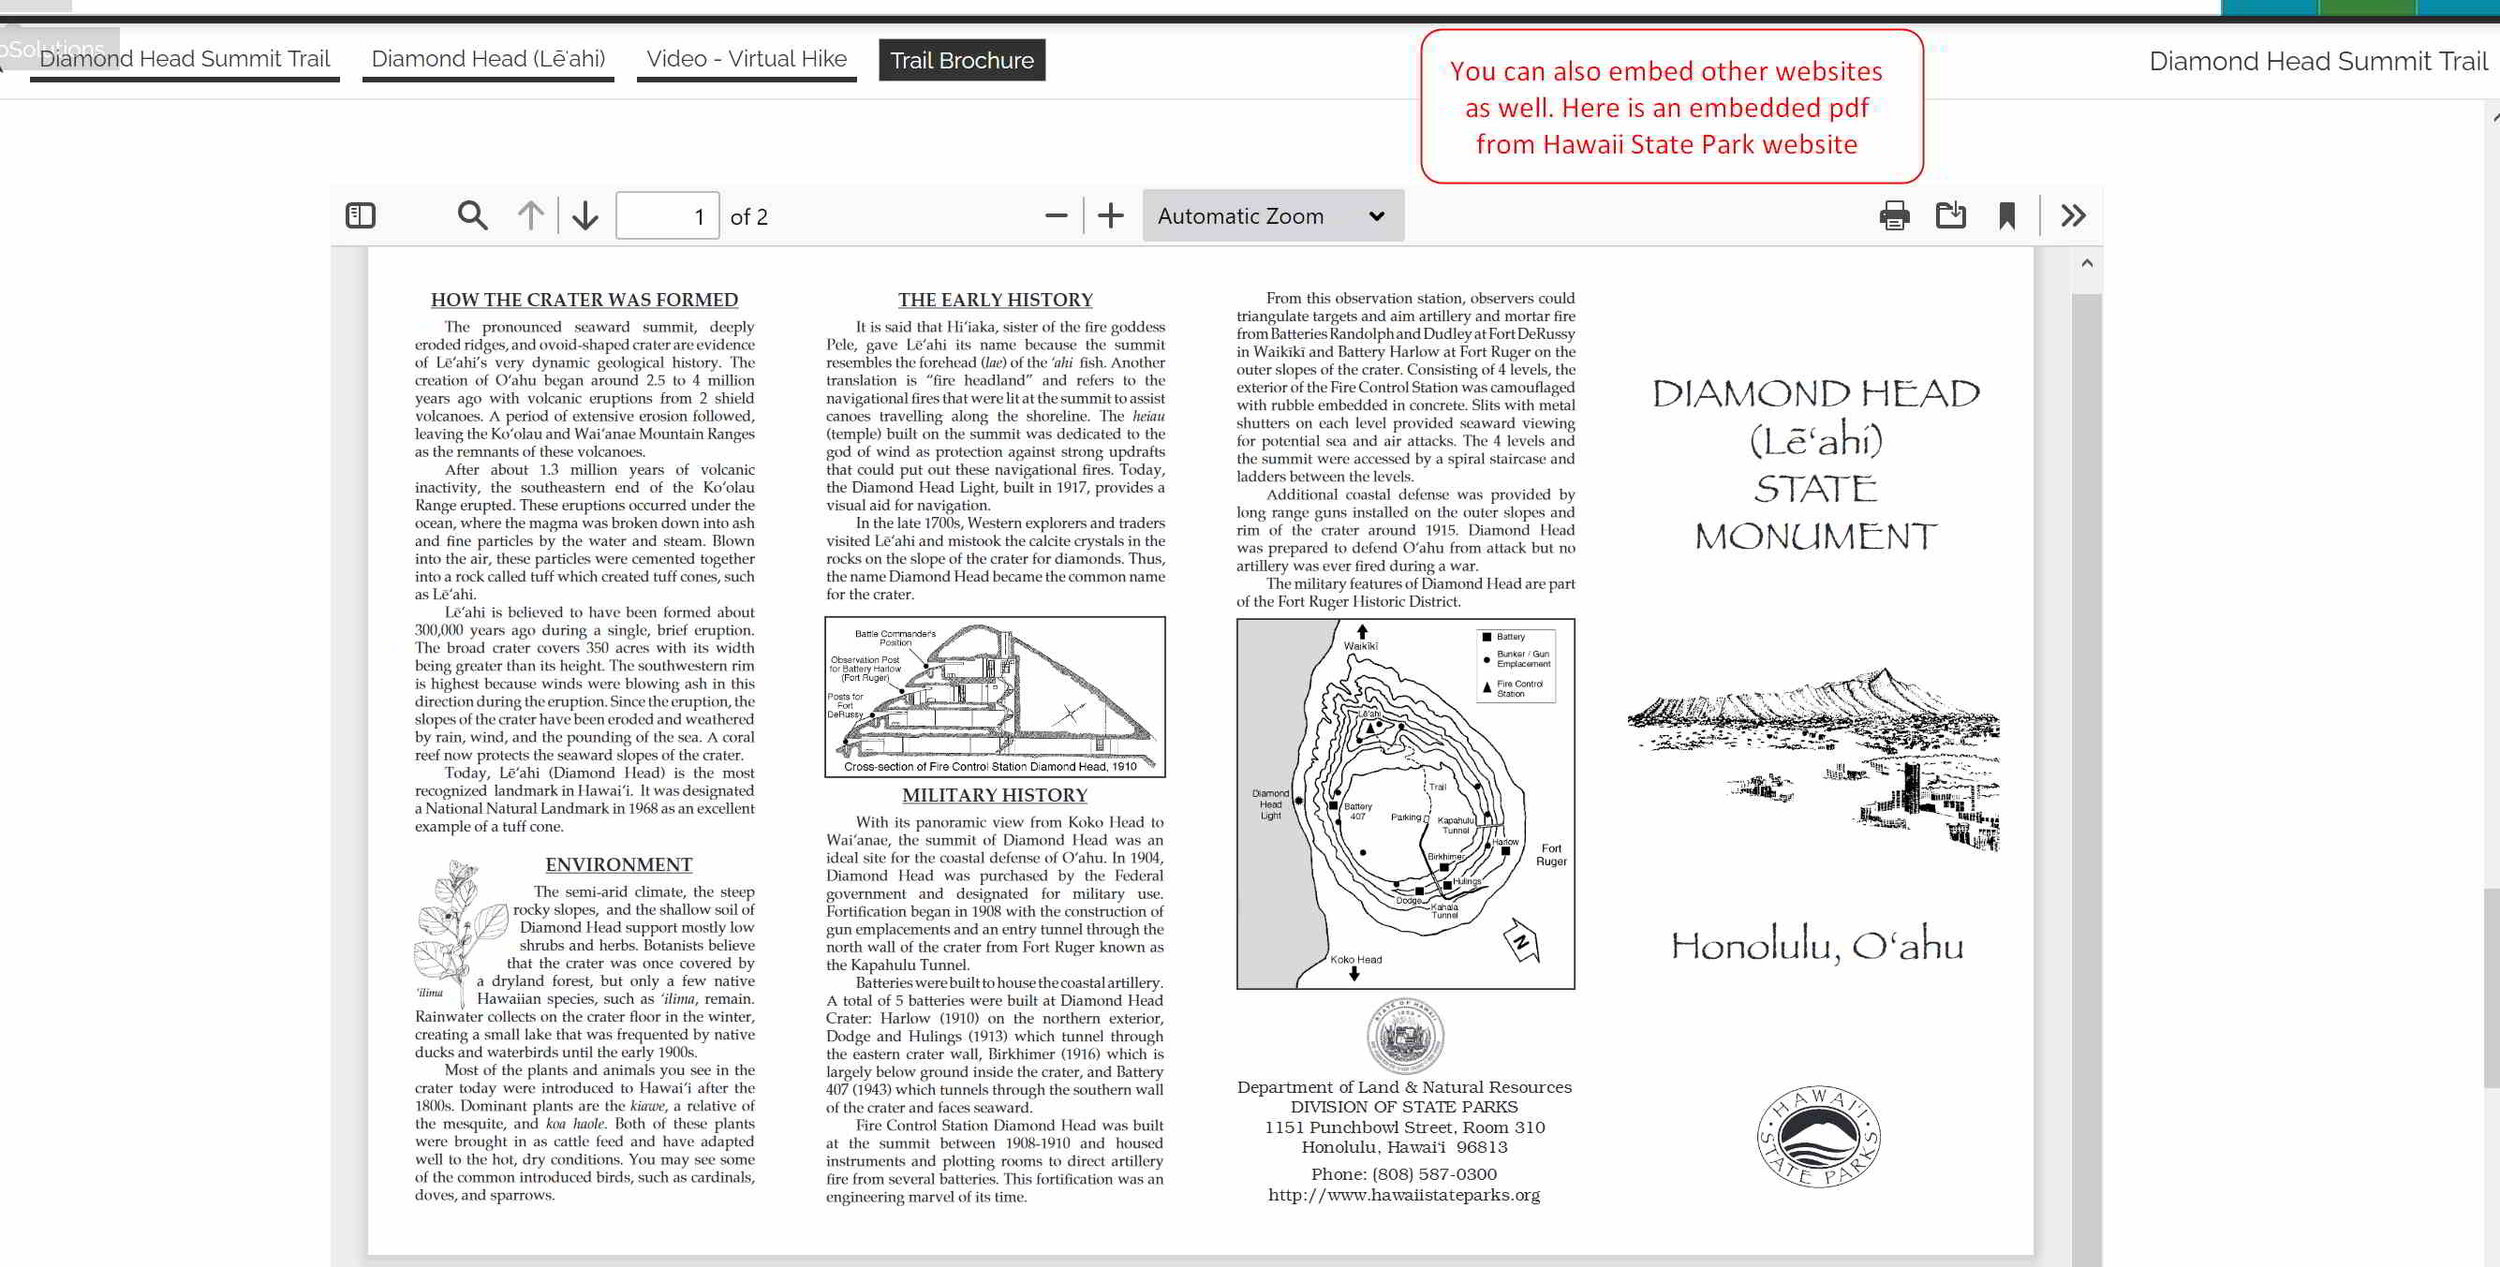
Configured MapStore Application

Below are some slides to show what my configured application looks like. If you’d like to explore MapStore without doing any installation, then check out the MapStore demo page.

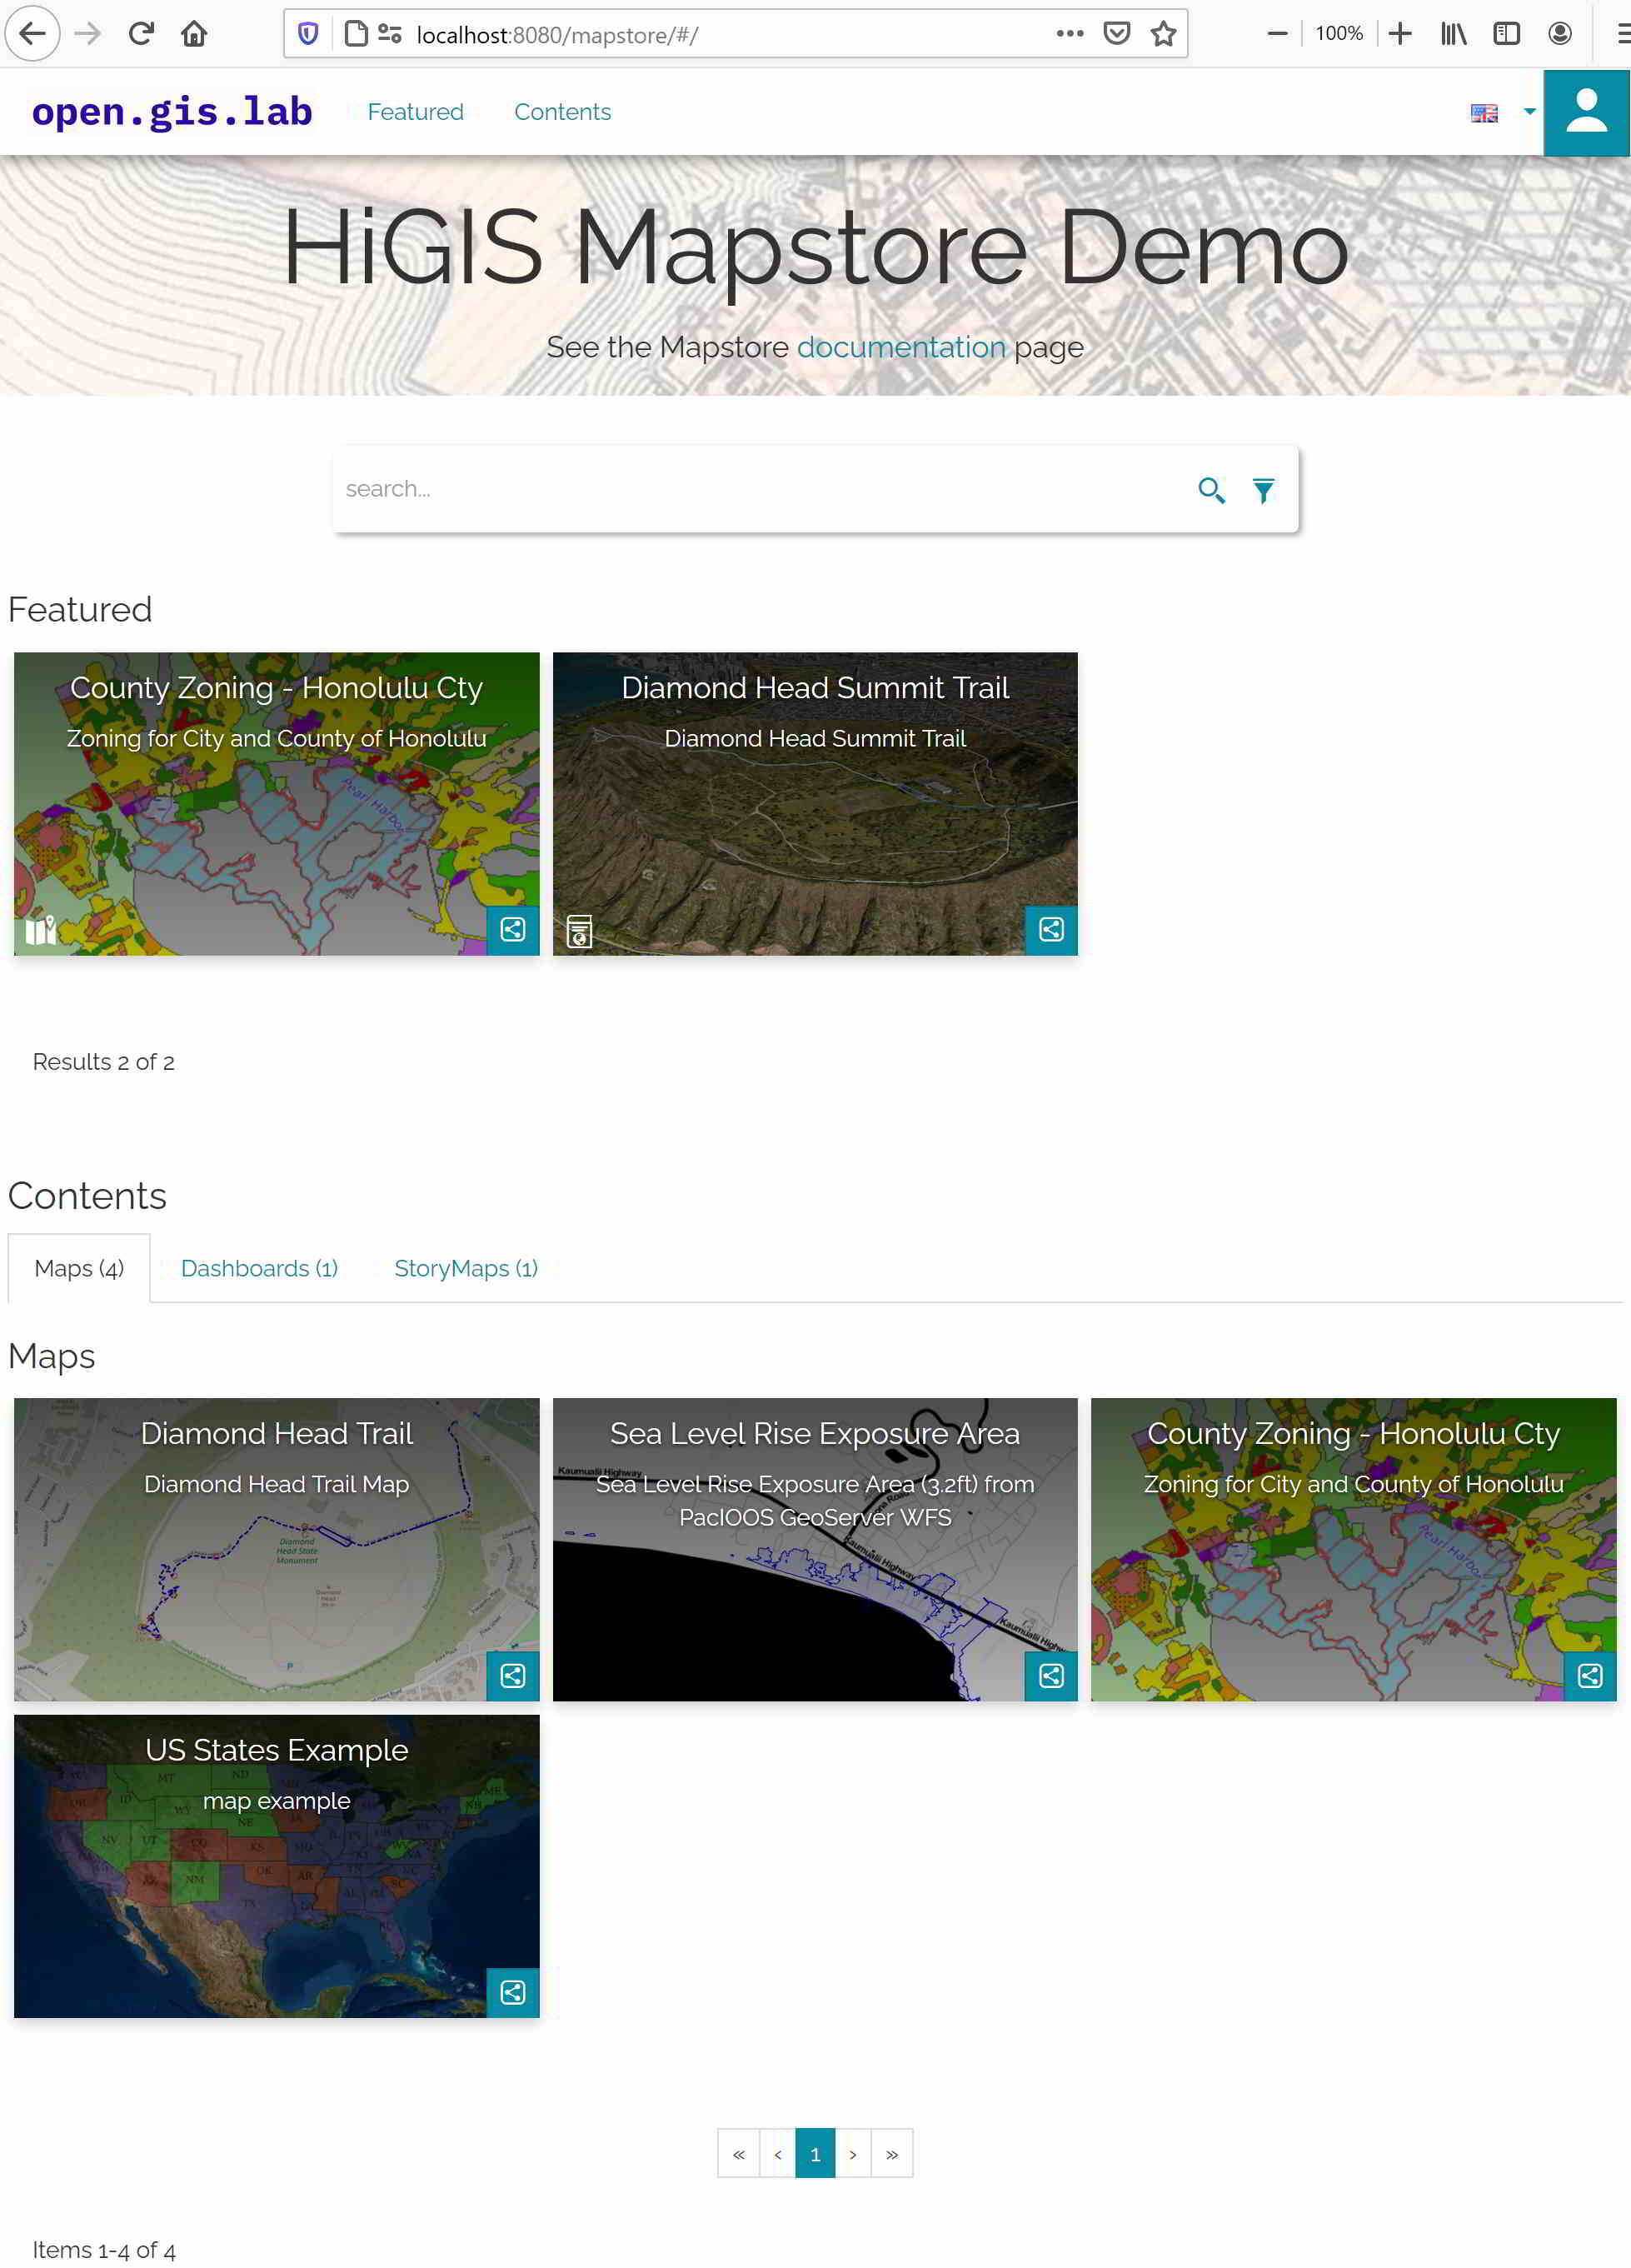
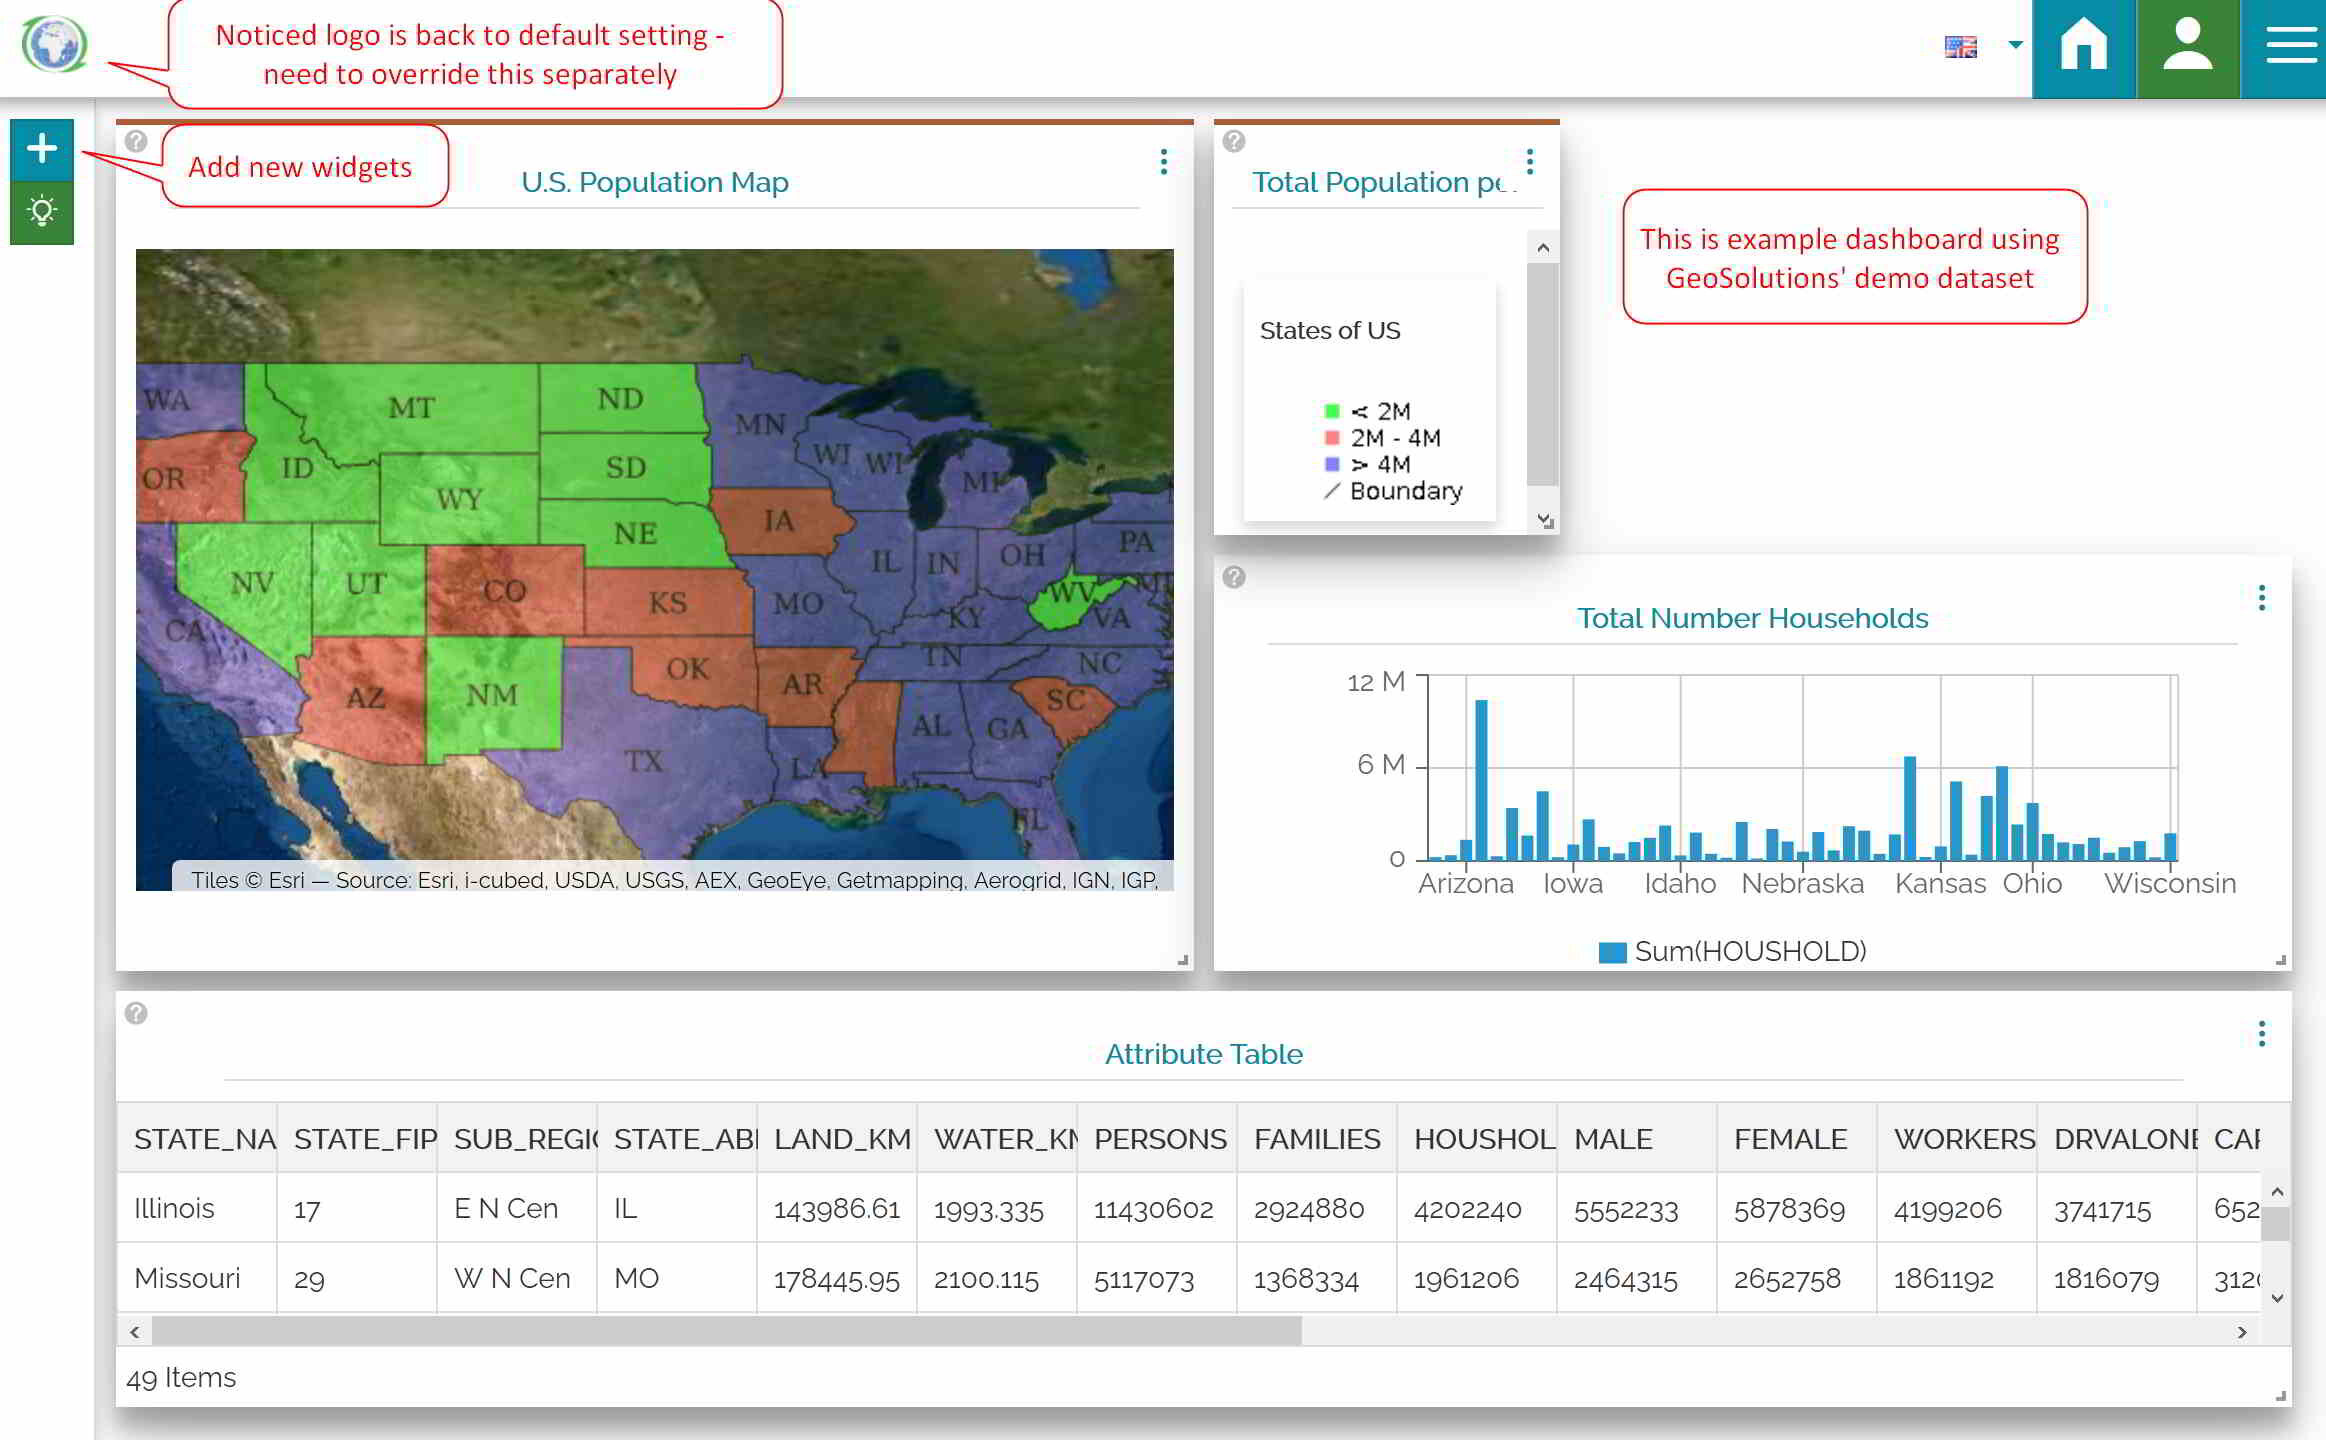
My first impressions of and thoughts on MapStore is that it’s a very good tool that is very flexible. Used in conjunction with GeoServer, PostgreSQL/PostGIS, and QGIS - you could create a nice opensource GIS stack solution. I think it’s worth a look. There is a bit of a learning curve - at least for me since I’m not a developer - but still it was doable. The only thing I had a little trouble with was the dashboard component - I could not quite get the data layers (via a public GeoServer WFS) set up properly to make the dashboard widgets to function the way I want it to. But then again this could be how the public GeoServer WFS may have been set up in the first place since it’s not something I have control over. I might have more luck with setting up my own GeoServer. The MapStore framework has other functionalities that I haven’t explored, but overall I am impress with what MapStore has to offer.

I hope this post was useful for those looking for an opensource web GIS options. Thanks for reading. Until next time.

Mapping and Viewing Geotagged Photos in QGIS

Today’s post is inspired by Joseph Kerski, who works at ESRI doing GIS in Education. You can read his post on Using the Photos with Locations Tool in Education. It provides some very useful information for on using ESRI software (AGOL) to map and view geotagged photos. We had an interesting discussion on teaching GIS in the academia (although I am no longer in academia - I still enjoy teaching and doing trainings). You can get a free public ArcGIS Online (AGOL) account if you’d like to give it a try. If you are a student, you can look into the Learn ArcGIS Student Program (launching September 1, 2020) that gives qualified students free access to AGOL and ArcGIS Pro for a year through a membership in the Learn ArcGIS organization. I think it’s good idea to learn both ArcGIS and QGIS.

Anyway, enough on ArcGIS. I thought I would a complementary posting on mapping and viewing geotagged photos in QGIS. If you have a need to map and view your geotagged photos then this post is for you. A geotagged photo has associated geographic location added to it by a process called geotagging. The geographic information (latitude, longitude, altitude, bearing or direction, and date/time stamp, etc.) are stored in the image’s EXIF header. If you have ever taken photos with your smartphone then most likely your photos as geotagged (assuming geolocation is enabled on your phone). Geotagged photo can be mapped and viewed in QGIS.

The only requirement to this short tutorial is that you must have photos that are already geotagged. Also, if you wan to create a web map then you need to have qgis2web plugin installed. As for QGIS version, I am using QGIS 3.14 Pi.

Step 1: Import Geotagged Photos

In QGIS: Go to the Processing Toolbar panel. If you don’t see the Processing Toolbar Panel then go to Processing Menu >> Toolbar.

Fig0001.jpg

In the Processing Toolbar panel >> Vector Creation >> Double click on Import Geotagged Photos.

Fig0002.jpg

In the Import Geotagged Photos window:

  1. Input Folder: Browse to where your photos are stored

  2. Photos [optional]: Click the drop down arrow >> Save to File. Select a file format. In this example, I’m just saving as a SHP.

  3. Click Run

Fig0003.jpg

After running the tool, you should have the point file added to your map. If you open up the attribute table of the point file, you should see something similar to the table below. Note that photo field contains the file path to the photos - you use this field below in the HTML Map Tip and to “symbolize” the points later.

Fig0033.jpg

Step 2: View Photos in Popup

Open the point layer properties:

  1. Go to the Display option.

  2. For HTML Map Tip: you can just simple use the <img> HTML tag with the source to your photo.

  3. Click Ok with done

Here is my example using the photo field (from attribute table). Note if file path is local - that is on your local drive then you will need to include file:/// to indicate the photo stored locally.

Simple example: <img src="file:///[% photo %]" width="350" height="250">

Another example: description is a new field I added to my attribute (see step further down)
<table>
<tr>
<th>[% descriptio %]</th>
</tr>
<tr>
<th><img src="file:///[% photo %]" width="350" height="250"></th>
</tr>
</table>

Fig0006.jpg

To view the photos in a popup:

  1. Turn on or enable the Map Tip and

  2. Hover your mouse on a point on your map to view your photo. Note my photo also include a description at the top — which you can add by editing the attribute table (see Optional Steps below)

Fig0014.jpg

Step 3: Show Direction Photos were Taken (OPTIONAL)

If you want to show the direction in which the photos were taken, you can do that. Just use an arrow symbol and rotation based on the Direction field (that is in your attribute table).

Open up the Layer Properties:

  1. Go to Symbology

  2. Select a Simple Marker

  3. Select arrow symbol or whatever symbol you want

  4. Rotation: Click the drop down arrow >> Field Type >> Direction

  5. Click OK and you should see the arrow symbol pointing in the direction that the photo was taken

Fig0019.jpg

Here is my example. I just made copies of my geotagged photo point layer and showed it as points and arrow to indicate direction.

Fig0020.jpg

Step 3A: Symbolize Points Using the Photos (OPTIONAL)

So what if you wanted to show the point locations using the photos themselves? You can do this with the raster

Open up Layer Properties >>

  1. Go to Symbology

  2. Click on Simple Marker

  3. Symbol Layer Type: click the drop down >> Raster Image Marker

  4. Click the Data Define Override button >> Field Type >> Photo (this is field in your attribute table)

  5. Make any other changes to the size if you want (e.g. size = 30 to make thumbnail images bigger)

Fig0021.jpg

Here is what my example looks like, using the photos as raster images to symbolize my point locations.

Fig0022.jpg

Step 4: Create Web Map with Popup (OPTIONAL)

For this portion you will need to have your photos stored on the web somewhere and be accessible using a direct link (e.g. https:///www.yourwebsite.com/filename.jpg). Also you will need the QGIS2Web Plugin installed.

I’ve edited the attribute table of my geotagged photo layer to include a Description and URL fields that I’m going to use later for a quick web map. The URL and Description Fields are new fields that I’ve added to my table (which you won’t have in your table).

Edit Attribute Table to include photo uRL

  1. Toggle the Edit (pencil) button

  2. Add New Field: input field name (e.g. URL) and field type (text or string) and length (e.g. 100). I’ve also added a description field to describe my photo.

    e.g. <img src="https://www.opengislab.com/s/DiamondHeadView.JPG" width="350" height="250">

    Note: I chose to use the full <img> html tag in my URL (with widget type = text edit) as it’s easier to specify the width and height. The QGIS2Web plugin seems to only show the full photo size, which isn’t what I want. I’ve seen others use the photo field or a URL without <img> tag with widget type = Attachment and Integrated Document Viewer option as either Image or Web View with width and height set to either auto or actual values — Using these options doesn’t work for me and doesn’t produce the result I want.

  3. When done editing table, save it

  4. Don’t forget to toggle off the Edit

Fig0004.jpg

Hide Unwanted Fields in Popup

Lets say for my web map popup I only want to show the photos (i.e. URL field) and Description only. You can do this by hiding all the other fields you don’t want to display.

Open Layer Properties:

  1. Go to Attributes Form

  2. Click on a field (e.g .photo)

  3. Widget Type: Click drop down arrow >> Hidden

  4. Make sure URL field and Description both have Widget Type = Text Edit

  5. Click OK when done

Fig0024.jpg

Create Web Map Using QGIS2 Web Plugin

You must aleady have the qgis2web plugin installed to do this portion.

Go to Web Menu >> qgis2web >> Create Web Map

Fig0025.jpg

In the Export to Web Map window:

  1. Make sure your Geotagged Photo points are visible and popups are turned on. Noticed that only the URL and Description fields are visible. Also make sure you have a basemap (e.g. Stamen Toner Light). View the other tab options and make any changes you want.

  2. Select Leaflet (seems to be option that works best)

  3. Click Update Preview button to preview your map

  4. Click Export if preview looks good

Fig0026.jpg

The Export tab has an option to Export to Folder or to an FTP site. The qgis2web plugin with export web files which you can put on a web server.

Fig0035.jpg

The exported Leaflet web map (shown locally)

Fig0027.jpg

That’s it for this post on mapping and viewing geotagged photos in QGIS. I hope you find it useful, and thanks for reading as always. Until next time :).