This posting is on how to map wind vector (i.e. speed/magnitude and direction) and create an animation using QGIS. This is written for my friend, Jim at PacIOOS. Check them out for some awesome oceanographic data that are open and very accessible. I used their GeoServer services all the time for my tutorials.
What you’ll need if you want to follow along with this short tutorial.
Requirements:
QGIS software installed - (I’m using version 3.14 on Windows OS)
Wind data in netCDF format - you can download the sample below or use your own
Crayfish plugin for QGIS - if you want to do animation, otherwise it’s optional
For those who are not familiar with the netCDF format. It stands for network Common Data Form and is a file format for storing multi-dimensional scientific data,such as temperature, salinity, wind speed and direction. These data or variables can be mapped through time (a dimension) in GIS by making a layer from the netCDF file.
Download Wind Data
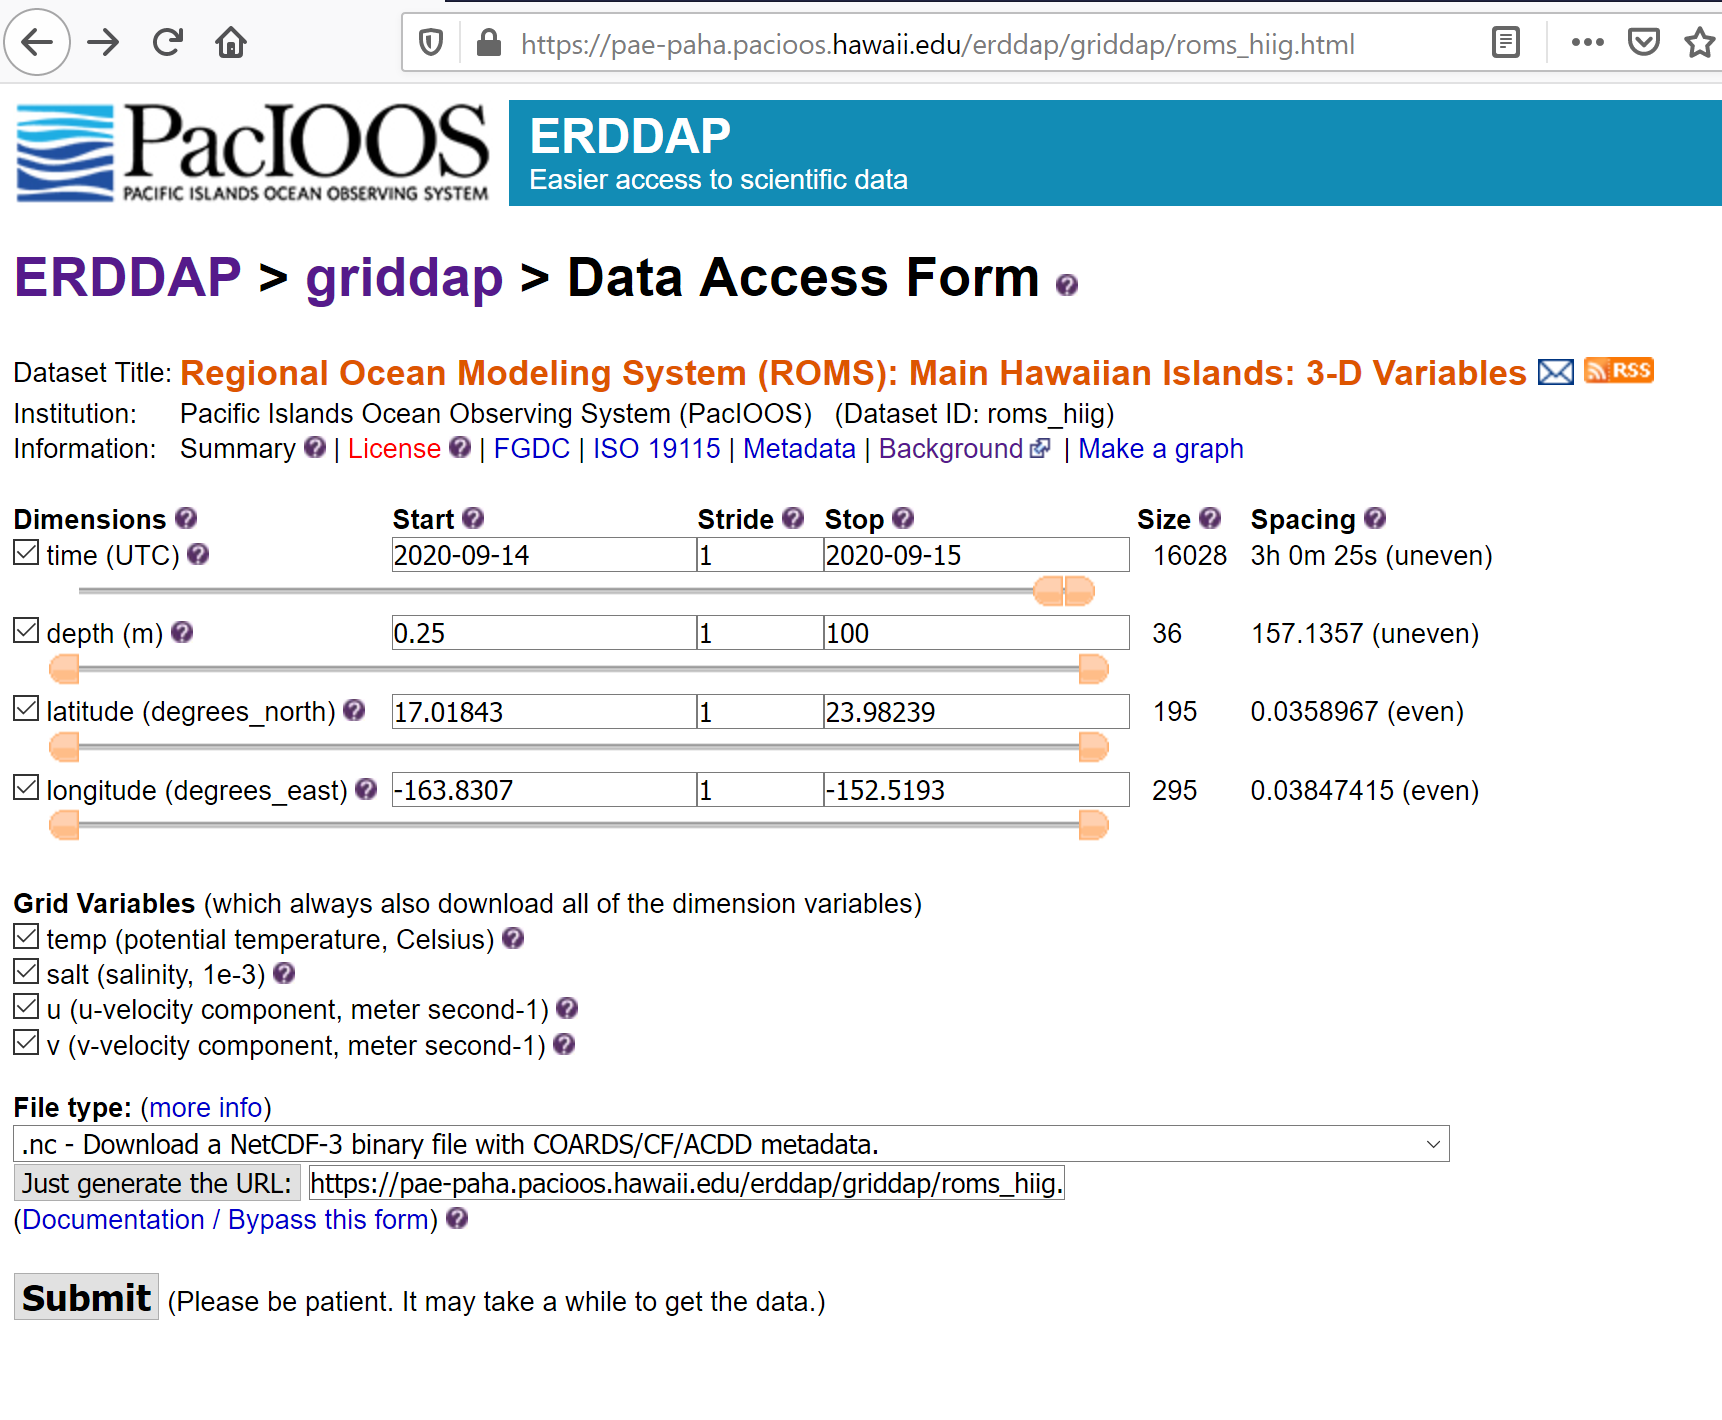
I am using the PacIOOS ERDAP (Environmental Research Division's Data Access Program) server to download my data. To download the exact data I used here, you can click the direct data download link below, or use your own data. The data set I’m using is the Regional Ocean Modeling System for the main Hawaiian Islands.
These are the parameters I used to query the data, which can be saved to a URL and shared for downloading: To use the same dataset for this tutorial, click this link: Direct Data Download.
Viewing netCDF data as a mesh
NetCDF data can be viewed in QGIS either as a raster or as a mesh. The mesh method is much more elegant and easy. Find more information about working with mesh data in the QGIS user manual.
Here’s how.
Open up QGIS
Browse to when you saved the netCDF data. Then either double click on the mesh data or drag and drop it into your TOC.

3. Notice in the TOC to the left of the filename there’s a clock to indicated that the netCDF is a temporal dataset. There’s also a question mark - if you hover on it will say layer has no coordinate reference system set. Click on the question mark to bring up the CRS selector window, define the coordinate system as WGS 84.

4. Open up the layer’s property window (right click layer name >> Properties). If you go to Source section to view information about available datasets in the netCDF

5. Go to Symbology section, then click on the Setting tab and display the wind contour (raster) and vector. You’ll notice there are 3 layers (temperature, salinity, wind velocity) in the netCDF file. By default QGIS will display the first layer in the group. You can change these settings. Don’t forget to click Apply button to see your changes.

6. Go to the Contour tab to change how you want to change the way the wind contour is displayed. Make your changes then click Apply to see your changes. I’m using the default settings with transparency of 50%.
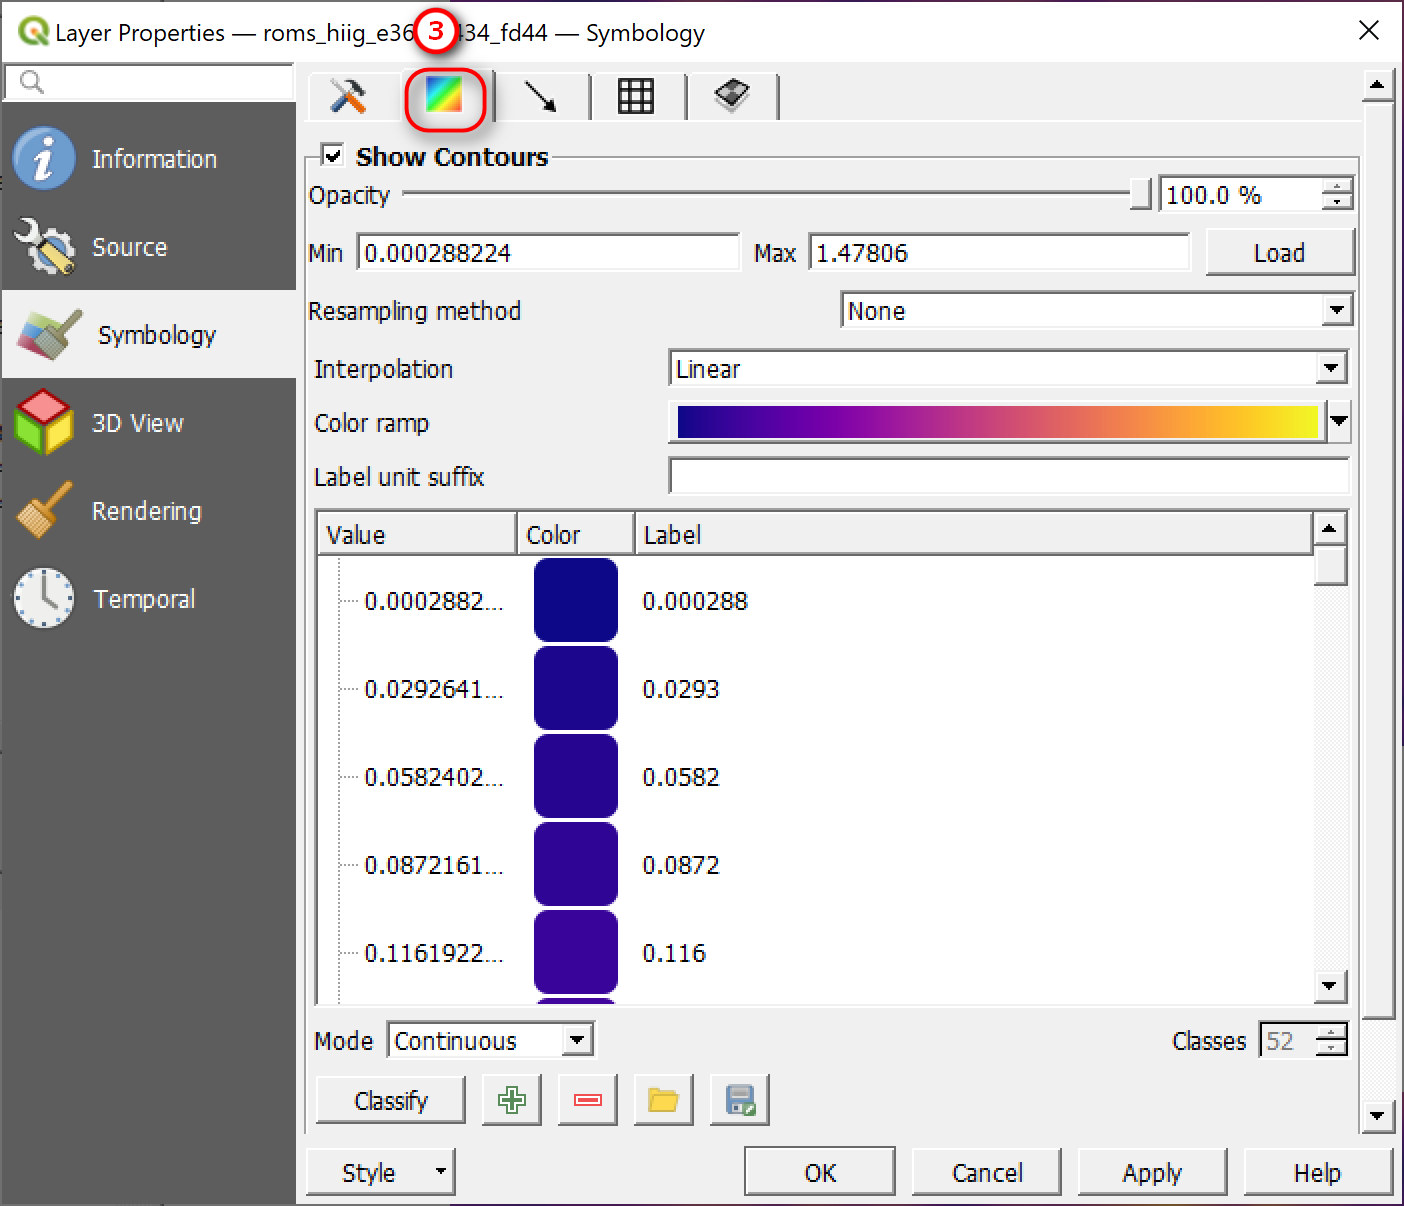
7. Go to the Vector tab (arrow) to change how you want the vector to display as either an arrow, streamlines or traces. Try instead of showing the arrows as a single color, try changing it to Color Ramp Shade. I’m using a default settings. Click Apply when done making your change.

Note: if you do not see the vector arrows displayed on your map after making your changes here, go back to the Source section (#1 above) and select a time frame for the vector. Select none for the Scalar Dataset Group if you only want to view the vector on the map — see my display below.

Feel free to explore the mesh rendering tab (regular square grid or triangular faces) and vertical layer stacking.
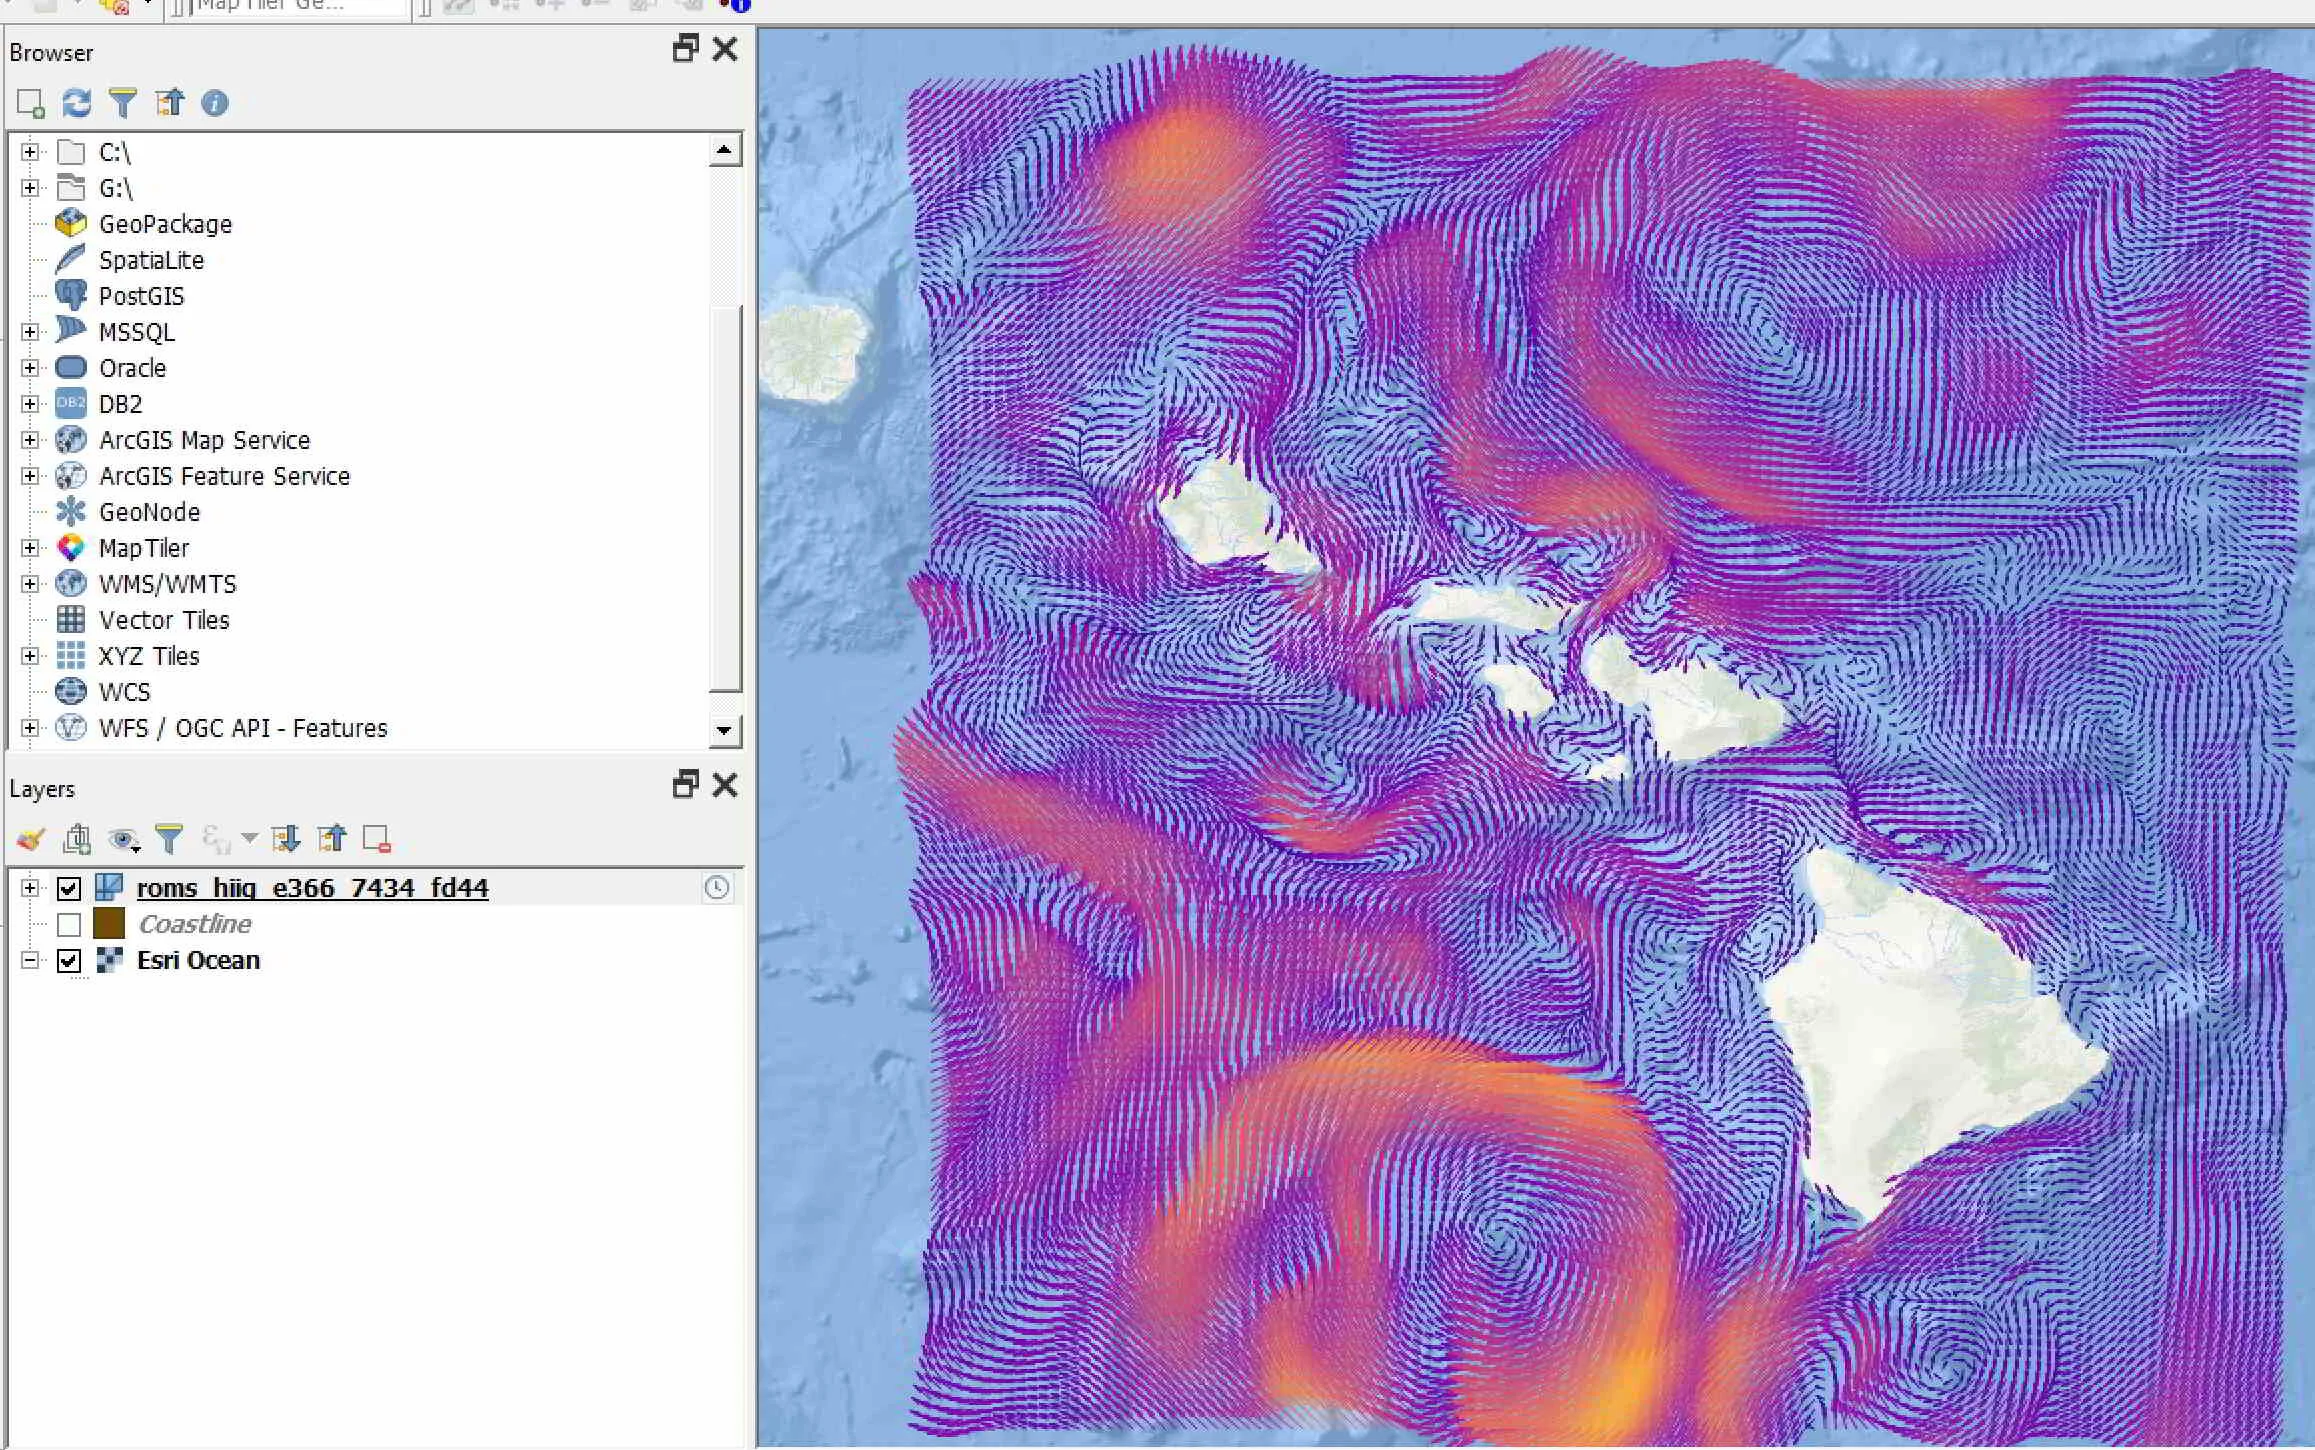
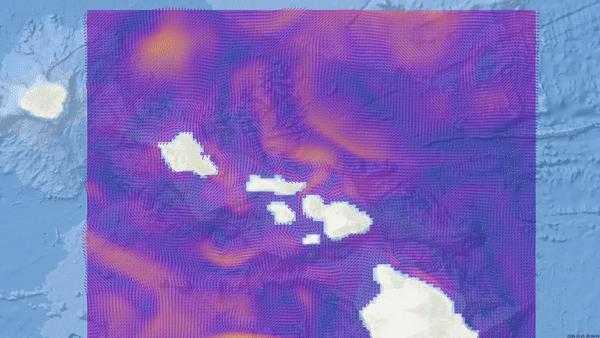
This is how my wind vector look likes. My display is showing only the vectors overlaid on top an ESRI bathymetry (ocean) basemap.
Animate vector using Crayfish plugin
If you want to animate your vector, you can do this using the Crayfish plugin. This plugin gives you more functionalities with mesh data. Here I’m using just to create an animation for my vector data. The video created will be in avi format.
Install the Crayfish plugin. Go to the Plugin menu >> Manage and Install Plugins. In the Plugins window, search for Crayfish and install it.
Once you have the plugin installed - you can access the tool in the Mesh menu >> Cray >> Export Animation. For other tools, you can access them in the Processing Toolbar panel
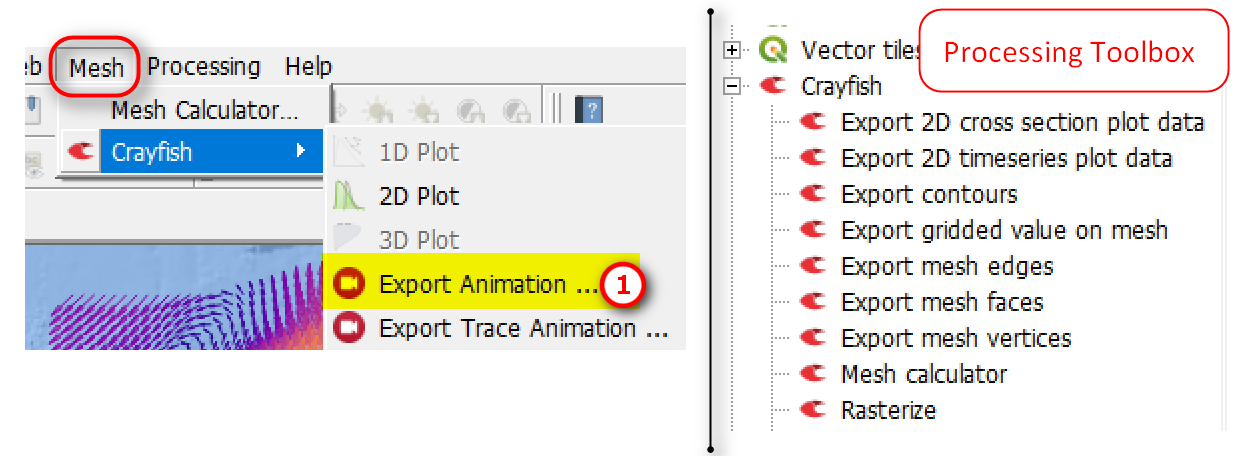
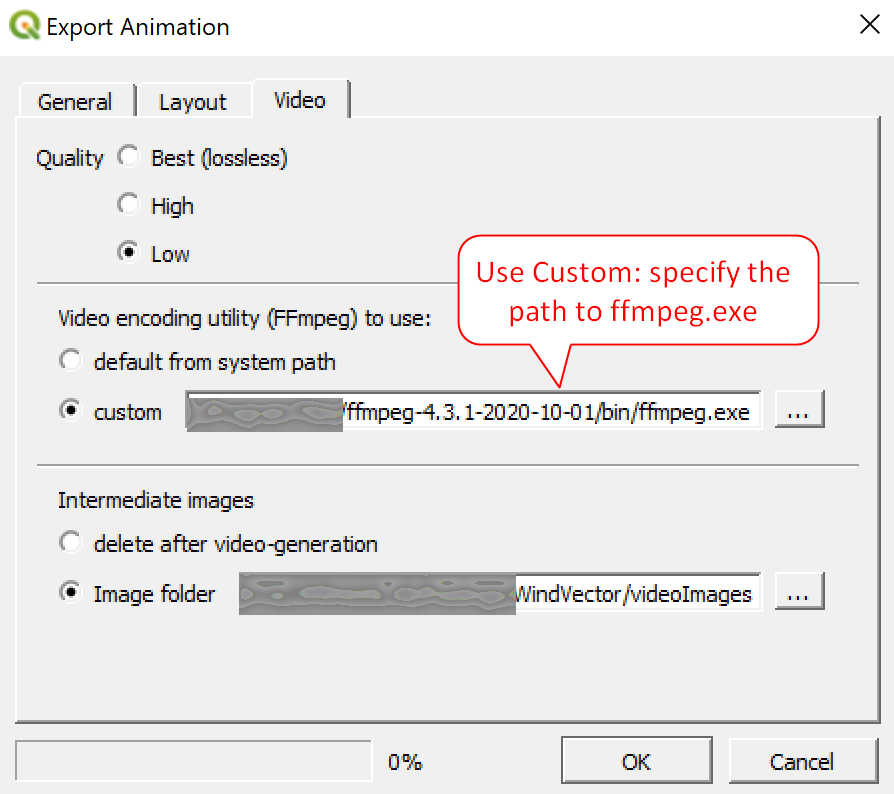
3. In the Export Animation window, enter the parameters you want. I’m using mostly the default settings. Don’t forget to select a Start Time and End Time. You have the option to save the images as well to create animated gif.

NOTE: if you get an error about FFmpeg is missing. You need to download FFmpeg and extract it to your computer then specify the path to FFmpeg.exe in the Export Animation window.

Here is my vector animation shown as a gif.
Converting raster wind vector to a point layer with u, v, speed and direction
So, what if you have raster(s) containing the u (eastward x-axis) and v (northward y-axis) components and you want to convert to a point layer (e.g. shapefile) and use arrows to show the wind speed and direction (wind vectors). This section will show you how to do that. But first, you’ll need to do some calculations. See this wind direction quick reference for calculating wind direction and speed and other tips. Also keep in mind that wind direction is described differently for oceanography and meteorology. Oceanographers describe the wind in the direction that it’s flowing towards and meteorologist describes wind in the direction that it’s flowing from.
Wind Speed (magnitude) = sqrt ( u * u + v * v )
Wind Direction = Atan2 (v, u) is the same as Atan2(y, x)
If you read the quick referenced guide linked above, there is tip on some software, especially spreadsheets using the Atan2 (x, y), where x and y are switched. QGIS uses the atan2(y, x), which return values in radians. To convert radians to degrees (symbol rotation), multiply it by 180/pi.
Oceanographic Convention: (180/3.14) * Atn2(v, u)
Meteorological Convention: (180/3.14) * Atn2(v, u)+180
Instead of using the mesh version of the netCDF data, add the raster version of it into your map. When you double click on the netCDF raster, QGIS will ask you to select variables you want to view. Select the u and v components and add to your map

2. Using the u raster grid, create a point
Go to the Processing Toolbar >> Vector Creation >> Raster Pixels to Points
In the Raster Pixels to Points window:
Select the u raster grid
Band 1 band/time frame combo
Field name: change to U (u values from the raster will be written out to this field)
Vector points: Save as a permanent layer (e.g. WindVectorPoints.shp)
Check the box, Open output file after running
Run the process

You should get a point layer that is the centroid of each raster cell of your grid.

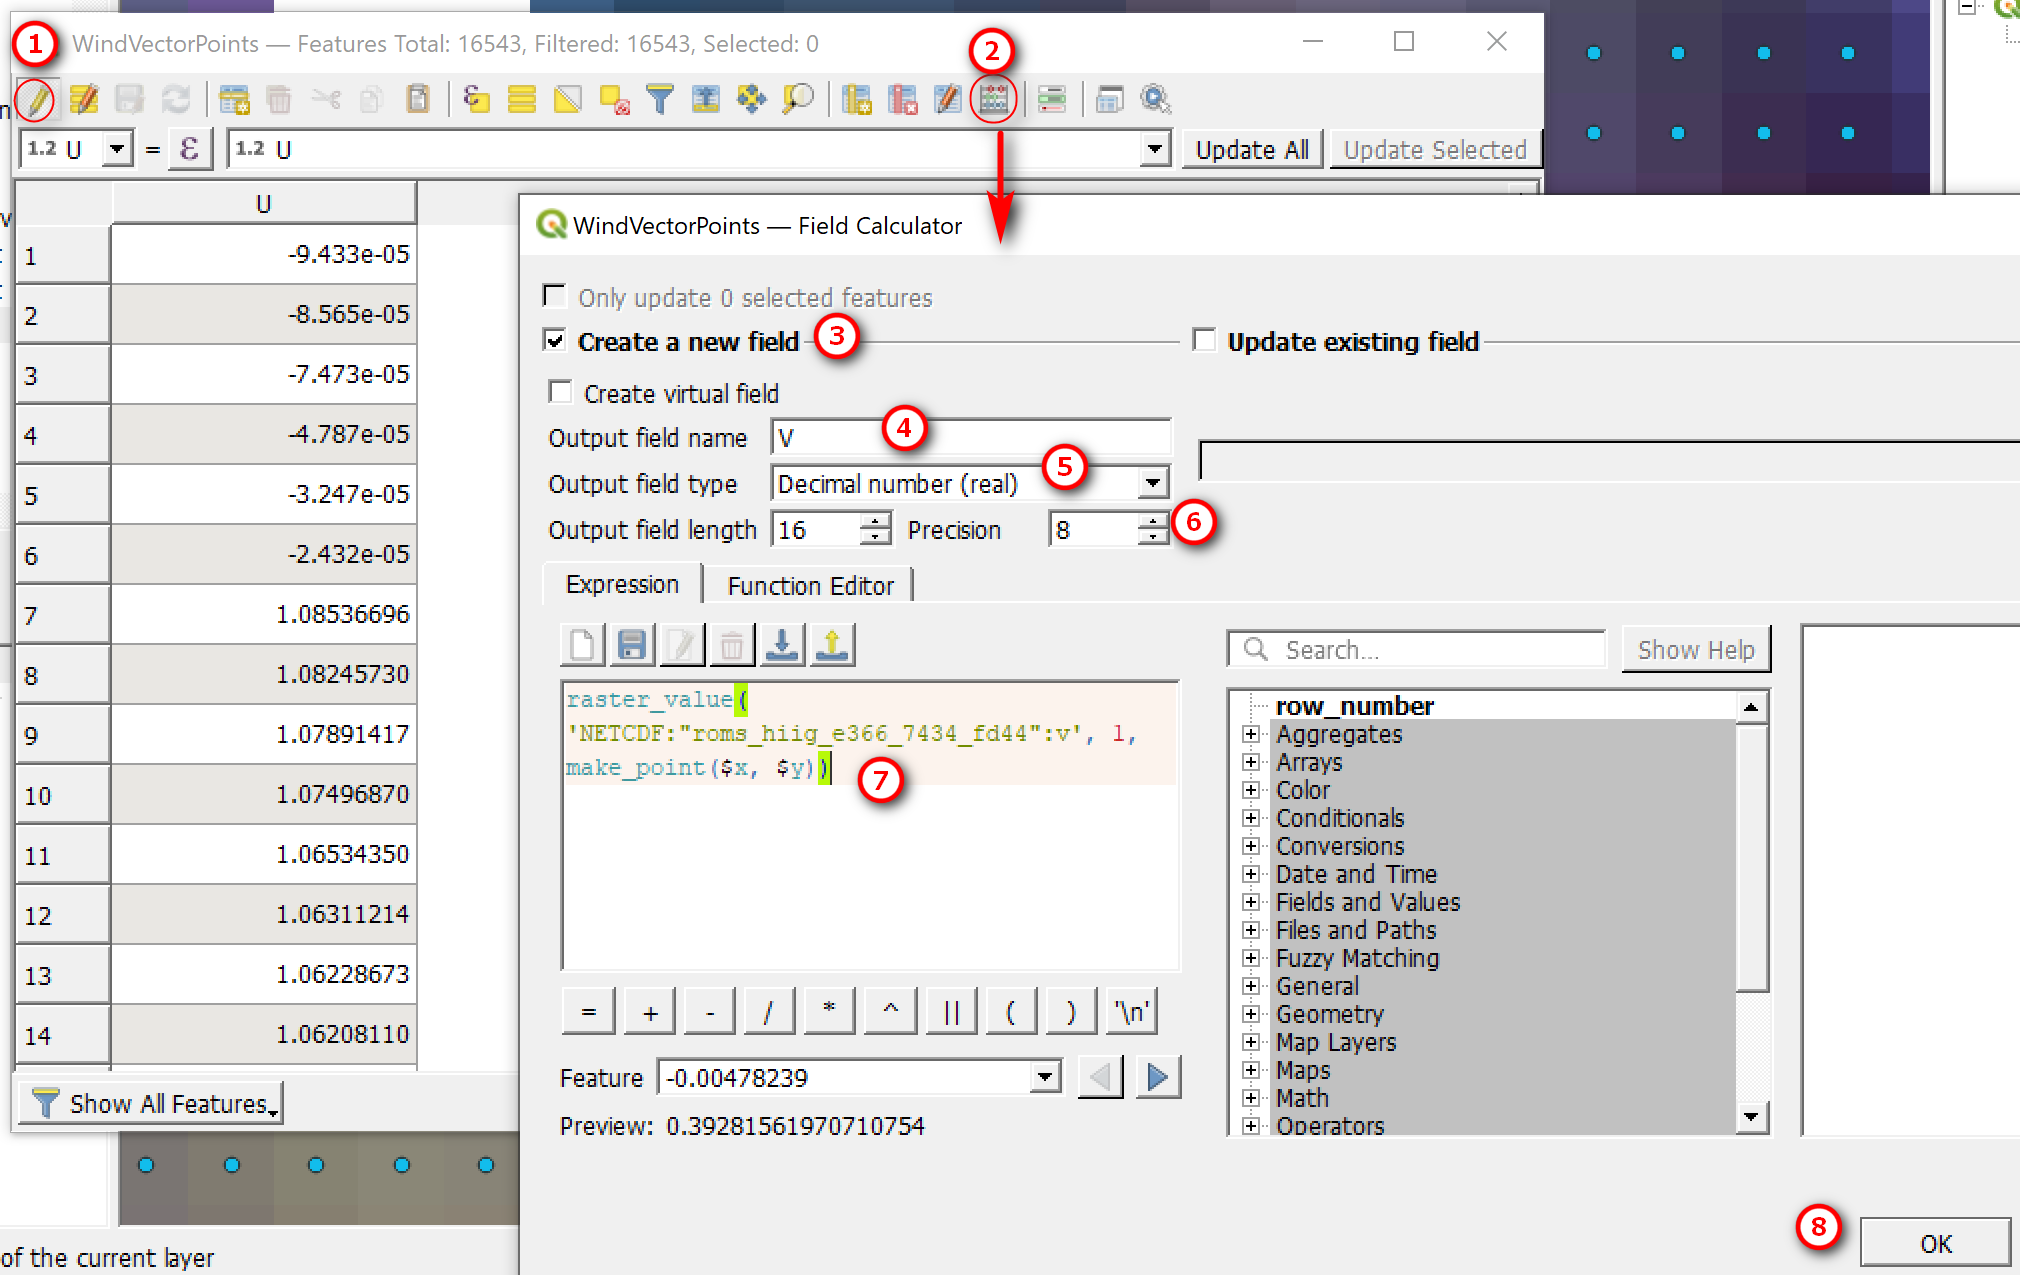
3. Open up the attribute table of you point layer just created. You should see the U values from raster grid. Using the Raster Calculator add the v values from the v grid.
Toggle on table editing (pencil button)
Open Field Calculator
Check Create a new field
Output field name: V
Output field type: Decimal number
Output field length and Precision: 16 and 8
In the Expression text box: type in the following
raster_value('NETCDF:"roms_hiig_e366_7434_fd44":v', 1, make_point($x, $y))
The syntax: raster_value('raster', 1, make_point($x, $y)) where raster is the filename of your v raster grid
Click Run
4. Keep your attribute table open and calculate wind speed using the the field calculator. Remember speed = sqrt(uu + vv)
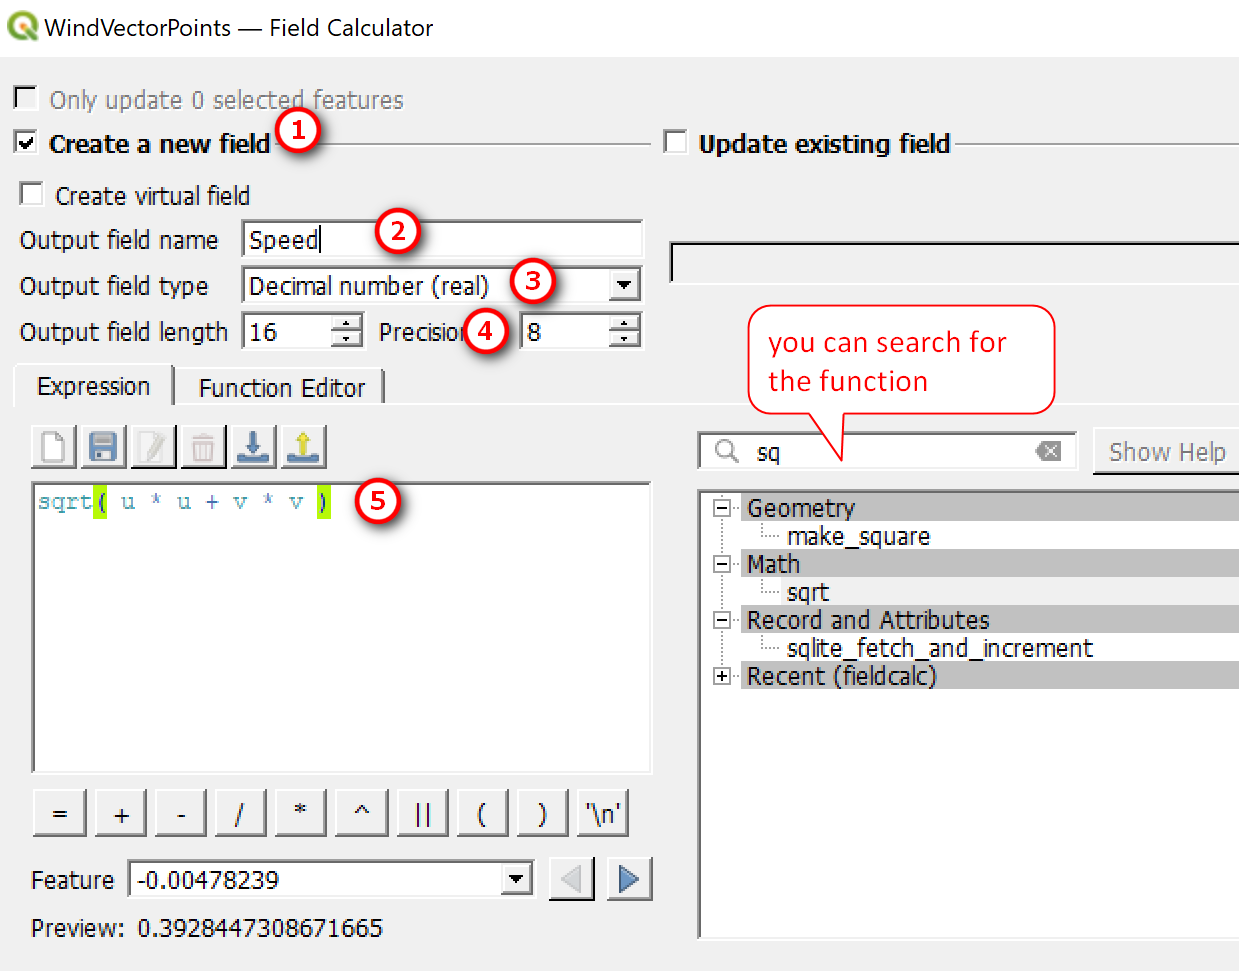
5. Calculate the wind direction using the formula given above. Don’t forget to convert radians to degrees

Save your table and don’t forget to toggle off editing. You point layer should now have values for u, v, speed, and direction.

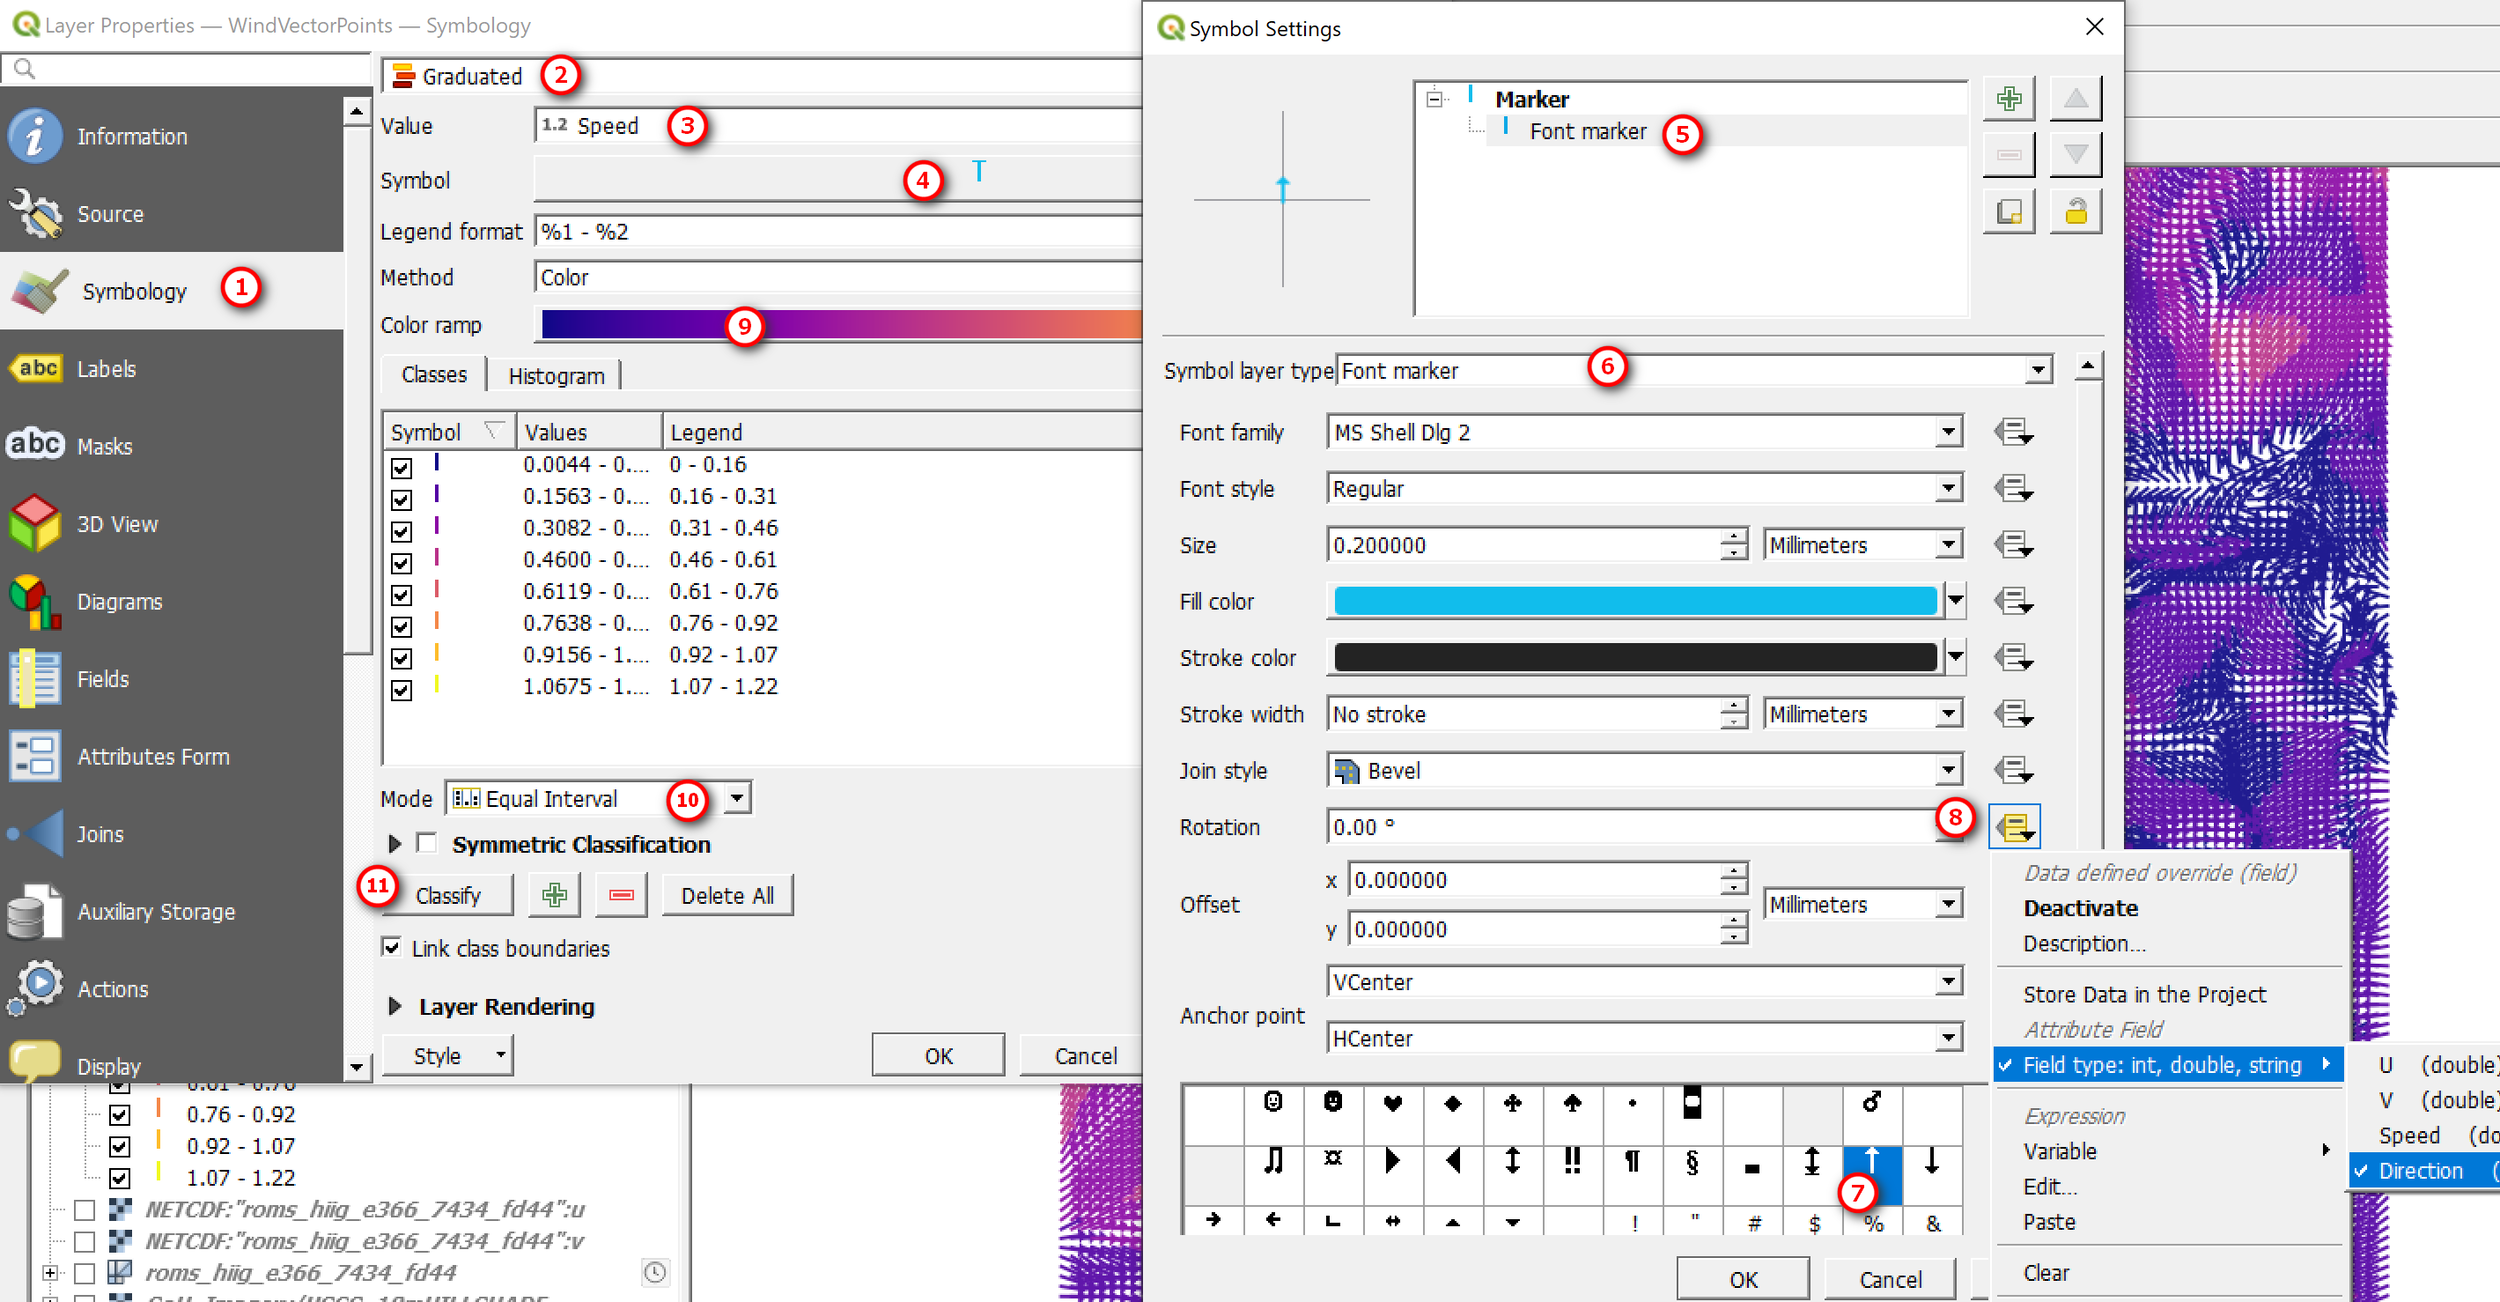
Mapping the wind vector using the point layer
Now that you have all the information you can map the wind vector using the point layer you just created.
Open the Properties window of your point layer. The following this guide below to display the points as arrows in the direction of the wind (rotated using the direction values)
Go to Symbology section
Change the Single symbology to Graduated style
Value: Select Speed
Click on the point Symbol
Click on Simple Marker
Symbol layer type: select Font maker
Choose an arrow character (must be point up or north)
For Rotation: click the custom variable button >> Field type >> Direction
Optional - change font symbol size if you want
Click OK to Symbol Settings
Back in the main symbology window, select a color ramp
Mode: Use Equal Interval
Click Classify (change the number of classes if you want)
Click Ok when done
Here’s what my point vector map looks like (zoomed in a bit to show the arrows and overlaid on to of ESRI basemap). Yours may look differently depending on how you choose to symbolize the point vectors.

Here’s a comparison of the point vector map and the mesh vector - the mesh version is much more refined and more efficient for mapping vectors. You can also view the mesh as a 3D map, but that’s for another time.

Point wind vector map (left) and mesh wind vector map (right).
Hopefully, this tutorial provides a brief guide on how to map and animate wind vectors. There are lots of options for how you want to view wind vectors, so play around with the settings. Thanks for reading. Until my next post.